This is the multi-page printable view of this section. Click here to print.
PG Admin
- PG Logical Replication Explained
- Query Optimization: The Macro Approach with pg_stat_statements
- Rescue Data with pg_filedump?
- Collation in PostgreSQL
- PostgreSQL Replica Identity Explained
- Slow Query Diagnosis
PG Logical Replication Explained
Logical Replication
Logical Replication is a method of replicating data objects and their changes based on the Replica Identity (typically primary keys) of data objects.
The term Logical Replication contrasts with Physical Replication, where physical replication uses exact block addresses and byte-by-byte copying, while logical replication allows fine-grained control over the replication process.
Logical replication is based on a Publication and Subscription model:
- A Publisher can have multiple publications, and a Subscriber can have multiple subscriptions.
- A publication can be subscribed to by multiple subscribers, while a subscription can only subscribe to one publisher, but can subscribe to multiple different publications from the same publisher.
Logical replication for a table typically works like this: The subscriber takes a snapshot of the publisher’s database and copies the existing data in the table. Once the data copy is complete, changes (inserts, updates, deletes, truncates) on the publisher are sent to the subscriber in real-time. The subscriber applies these changes in the same order, ensuring transactional consistency in logical replication. This approach is sometimes called transactional replication.
Typical use cases for logical replication include:
- Migration: Replication across different PostgreSQL versions and operating system platforms.
- CDC (Change Data Capture): Collecting incremental changes in a database (or a subset of it) and triggering custom logic on subscribers for these changes.
- Data Integration: Combining multiple databases into one, or splitting one database into multiple, for fine-grained integration and access control.
A logical subscriber behaves like a normal PostgreSQL instance (primary), and can also create its own publications and have its own subscribers.
If the logical subscriber is read-only, there will be no conflicts. However, if writes are performed on the subscriber’s subscription set, conflicts may occur.
Publication
A Publication can be defined on a physical replication primary. The node that creates the publication is called the Publisher.
A Publication is a collection of changes from a set of tables. It can also be viewed as a change set or replication set. Each publication can only exist in one Database.
Publications are different from Schemas and don’t affect how tables are accessed. (Whether a table is included in a publication or not doesn’t affect its access)
Currently, publications can only contain tables (i.e., indexes, sequences, materialized views are not published), and each table can be added to multiple publications.
Unless creating a publication for ALL TABLES, objects (tables) in a publication can only be explicitly added (via ALTER PUBLICATION ADD TABLE).
Publications can filter the types of changes required: any combination of INSERT, UPDATE, DELETE, and TRUNCATE, similar to trigger events. By default, all changes are published.
Replica Identity
A table included in a publication must have a Replica Identity, which is necessary to locate the rows that need to be updated on the subscriber side for UPDATE and DELETE operations.
By default, the Primary Key is the table’s replica identity. A UNIQUE NOT NULL index can also be used as a replica identity.
If there is no replica identity, it can be set to FULL, meaning the entire row is used as the replica identity. (An interesting case: multiple identical records can be handled correctly, as shown in later examples) Using FULL mode for replica identity is inefficient (because each row modification requires a full table scan on the subscriber, which can easily overwhelm the subscriber), so this configuration should only be used as a last resort. Using FULL mode for replica identity also has a limitation: the columns included in the replica identity on the subscriber’s table must either match the publisher or be fewer than on the publisher.
INSERT operations can always proceed regardless of the replica identity (because inserting a new record doesn’t require locating any existing records on the subscriber; while deletes and updates need to locate records through the replica identity). If a table without a replica identity is added to a publication with UPDATE and DELETE, subsequent UPDATE and DELETE operations will cause errors on the publisher.
The replica identity mode of a table can be checked in pg_class.relreplident and modified via ALTER TABLE.
ALTER TABLE tbl REPLICA IDENTITY
{ DEFAULT | USING INDEX index_name | FULL | NOTHING };
Although various combinations are possible, in practice, only three scenarios are viable:
- Table has a primary key, using the default
defaultreplica identity - Table has no primary key but has a non-null unique index, explicitly configured with
indexreplica identity - Table has neither primary key nor non-null unique index, explicitly configured with
fullreplica identity (very inefficient, only as a last resort) - All other cases cannot properly complete logical replication functionality. Insufficient information output may result in errors or may not.
- Special attention: If a table with
nothingreplica identity is included in logical replication, performing updates or deletes on it will cause errors on the publisher!
| Replica Identity Mode\Table Constraints | Primary Key(p) | Unique NOT NULL Index(u) | Neither(n) |
|---|---|---|---|
| default | Valid | x | x |
| index | x | Valid | x |
| full | Inefficient | Inefficient | Inefficient |
| nothing | xxxx | xxxx | xxxx |
Managing Publications
CREATE PUBLICATION is used to create a publication, DROP PUBLICATION to remove it, and ALTER PUBLICATION to modify it.
After a publication is created, tables can be dynamically added to or removed from it using ALTER PUBLICATION, and these operations are transactional.
CREATE PUBLICATION name
    [ FOR TABLE [ ONLY ] table_name [ * ] [, ...]
      | FOR ALL TABLES ]
    [ WITH ( publication_parameter [= value] [, ... ] ) ]

ALTER PUBLICATION name ADD TABLE [ ONLY ] table_name [ * ] [, ...]
ALTER PUBLICATION name SET TABLE [ ONLY ] table_name [ * ] [, ...]
ALTER PUBLICATION name DROP TABLE [ ONLY ] table_name [ * ] [, ...]
ALTER PUBLICATION name SET ( publication_parameter [= value] [, ... ] )
ALTER PUBLICATION name OWNER TO { new_owner | CURRENT_USER | SESSION_USER }
ALTER PUBLICATION name RENAME TO new_name

DROP PUBLICATION [ IF EXISTS ] name [, ...];
publication_parameter mainly includes two options:
publish: Defines the types of change operations to publish, a comma-separated string, defaulting toinsert, update, delete, truncate.publish_via_partition_root: New option in PostgreSQL 13, if true, partitioned tables will use the root partition’s replica identity for logical replication.
Querying Publications
Publications can be queried using the psql meta-command \dRp.
# \dRp
  Owner   | All tables | Inserts | Updates | Deletes | Truncates | Via root
----------+------------+---------+---------+---------+-----------+----------
 postgres | t          | t       | t       | t       | t         | f
pg_publication Publication Definition Table
pg_publication contains the original publication definitions, with each record corresponding to a publication.
# table pg_publication;
oid          | 20453
pubname      | pg_meta_pub
pubowner     | 10
puballtables | t
pubinsert    | t
pubupdate    | t
pubdelete    | t
pubtruncate  | t
pubviaroot   | f
puballtables: Whether it includes all tablespubinsert|update|delete|truncate: Whether these operations are publishedpubviaroot: If this option is set, any partitioned table (leaf table) will use the top-level partitioned table’s replica identity. This allows treating the entire partitioned table as one table rather than a series of tables for publication.
pg_publication_tables Publication Content Table
pg_publication_tables is a view composed of pg_publication, pg_class, and pg_namespace, recording the table information included in publications.
postgres@meta:5432/meta=# table pg_publication_tables;
   pubname   | schemaname |    tablename
-------------+------------+-----------------
 pg_meta_pub | public     | spatial_ref_sys
 pg_meta_pub | public     | t_normal
 pg_meta_pub | public     | t_unique
 pg_meta_pub | public     | t_tricky
Use pg_get_publication_tables to get the OIDs of subscribed tables based on the subscription name:
SELECT * FROM pg_get_publication_tables('pg_meta_pub');
SELECT p.pubname,
       n.nspname AS schemaname,
       c.relname AS tablename
FROM pg_publication p,
     LATERAL pg_get_publication_tables(p.pubname::text) gpt(relid),
     pg_class c
         JOIN pg_namespace n ON n.oid = c.relnamespace
WHERE c.oid = gpt.relid;
Similarly, pg_publication_rel provides similar information but from a many-to-many OID correspondence perspective, containing raw data.
  oid  | prpubid | prrelid
-------+---------+---------
 20414 |   20413 |   20397
 20415 |   20413 |   20400
 20416 |   20413 |   20391
 20417 |   20413 |   20394
It’s important to note the difference between these two: When publishing for ALL TABLES, pg_publication_rel won’t have specific table OIDs, but pg_publication_tables can query the actual list of tables included in logical replication. Therefore, pg_publication_tables should typically be used as the reference.
When creating a subscription, the database first modifies the pg_publication catalog, then fills in the publication table information into pg_publication_rel.
Subscription
A Subscription is the downstream of logical replication. The node that defines the subscription is called the Subscriber.
A subscription defines: how to connect to another database, and which publications from the target publisher to subscribe to.
A logical subscriber behaves like a normal PostgreSQL instance (primary), and can also create its own publications and have its own subscribers.
Each subscriber receives changes through a Replication Slot, and during the initial data replication phase, additional temporary replication slots may be required.
A logical replication subscription can serve as a synchronous replication standby, with the standby’s name defaulting to the subscription name, or a different name can be used by setting application_name in the connection information.
Only superusers can dump subscription definitions using pg_dump, as only superusers can access the pg_subscription view. Regular users attempting to dump will skip and print a warning message.
Logical replication doesn’t replicate DDL changes, so tables in the publication set must already exist on the subscriber side. Only changes to regular tables are replicated; views, materialized views, sequences, and indexes are not replicated.
Tables on the publisher and subscriber are matched by their fully qualified names (e.g., public.table), and replicating changes to a table with a different name is not supported.
Columns on the publisher and subscriber are matched by name. Column order doesn’t matter, and data types don’t have to be identical, as long as the text representation of the two columns is compatible, meaning the text representation of the data can be converted to the target column’s type. The subscriber’s table can contain columns not present on the publisher, and these new columns will be filled with default values.
Managing Subscriptions
CREATE SUBSCRIPTION is used to create a subscription, DROP SUBSCRIPTION to remove it, and ALTER SUBSCRIPTION to modify it.
After a subscription is created, it can be paused and resumed at any time using ALTER SUBSCRIPTION.
Removing and recreating a subscription will result in loss of synchronization information, meaning the relevant data needs to be resynchronized.
CREATE SUBSCRIPTION subscription_name
    CONNECTION 'conninfo'
    PUBLICATION publication_name [, ...]
    [ WITH ( subscription_parameter [= value] [, ... ] ) ]

ALTER SUBSCRIPTION name CONNECTION 'conninfo'
ALTER SUBSCRIPTION name SET PUBLICATION publication_name [, ...] [ WITH ( set_publication_option [= value] [, ... ] ) ]
ALTER SUBSCRIPTION name REFRESH PUBLICATION [ WITH ( refresh_option [= value] [, ... ] ) ]
ALTER SUBSCRIPTION name ENABLE
ALTER SUBSCRIPTION name DISABLE
ALTER SUBSCRIPTION name SET ( subscription_parameter [= value] [, ... ] )
ALTER SUBSCRIPTION name OWNER TO { new_owner | CURRENT_USER | SESSION_USER }
ALTER SUBSCRIPTION name RENAME TO new_name

DROP SUBSCRIPTION [ IF EXISTS ] name;
subscription_parameter defines some options for the subscription, including:
copy_data(bool): Whether to copy data after replication starts, defaults to truecreate_slot(bool): Whether to create a replication slot on the publisher, defaults to trueenabled(bool): Whether to enable the subscription, defaults to trueconnect(bool): Whether to attempt to connect to the publisher, defaults to true. Setting to false will force the above options to false.synchronous_commit(bool): Whether to enable synchronous commit, reporting progress information to the primary.slot_name: The name of the replication slot associated with the subscription. Setting to empty will disassociate the subscription from the replication slot.
Managing Replication Slots
Each active subscription receives changes from the remote publisher through a replication slot.
Typically, this remote replication slot is automatically managed, created automatically during CREATE SUBSCRIPTION and deleted during DROP SUBSCRIPTION.
In specific scenarios, it may be necessary to operate on the subscription and the underlying replication slot separately:
-
When creating a subscription, if the required replication slot already exists. In this case, you can associate with the existing replication slot using
create_slot = false. -
When creating a subscription, if the remote host is unreachable or its state is unclear, you can avoid accessing the remote host using
connect = false. This is whatpg_dumpdoes. In this case, you must manually create the replication slot on the remote side before enabling the subscription locally. -
When removing a subscription, if you need to retain the replication slot. This typically happens when the subscriber is being moved to another machine where you want to restart the subscription. In this case, you need to first disassociate the subscription from the replication slot using
ALTER SUBSCRIPTION. -
When removing a subscription, if the remote host is unreachable. In this case, you need to disassociate the replication slot from the subscription before deleting the subscription.
If the remote instance is no longer in use, it’s fine. However, if the remote instance is only temporarily unreachable, you should manually delete its replication slot; otherwise, it will continue to retain WAL and may cause the disk to fill up.
Querying Subscriptions
Subscriptions can be queried using the psql meta-command \dRs.
# \dRs
     Name     |  Owner   | Enabled |  Publication
--------------+----------+---------+----------------
 pg_bench_sub | postgres | t       | {pg_bench_pub}
pg_subscription Subscription Definition Table
Each logical subscription has one record. Note that this view is cluster-wide, and each database can see the subscription information for the entire cluster.
Only superusers can access this view because it contains plaintext passwords (connection information).
oid             | 20421
subdbid         | 19356
subname         | pg_test_sub
subowner        | 10
subenabled      | t
subconninfo     | host=10.10.10.10 user=replicator password=DBUser.Replicator dbname=meta
subslotname     | pg_test_sub
subsynccommit   | off
subpublications | {pg_meta_pub}
subenabled: Whether the subscription is enabledsubconninfo: Hidden from regular users because it contains sensitive information.subslotname: The name of the replication slot used by the subscription, also used as the logical replication origin name for deduplication.subpublications: List of publication names subscribed to.- Other status information: Whether synchronous commit is enabled, etc.
pg_subscription_rel Subscription Content Table
pg_subscription_rel records information about each table in the subscription, including status and progress.
srrelid: OID of the relation in the subscriptionsrsubstate: State of the relation in the subscription:iinitializing,dcopying data,ssynchronization completed,rnormal replication.srsublsn: When ini|dstate, it’s empty. When ins|rstate, it’s the LSN position on the remote side.
When Creating a Subscription
When a new subscription is created, the following operations are performed in sequence:
- Store the publication information in the
pg_subscriptioncatalog, including connection information, replication slot, publication names, and some configuration options. - Connect to the publisher, check replication permissions (note that it does not check if the corresponding publication exists),
- Create a logical replication slot:
pg_create_logical_replication_slot(name, 'pgoutput') - Register the tables in the replication set to the subscriber’s
pg_subscription_relcatalog. - Execute the initial snapshot synchronization. Note that existing data in the subscriber’s tables is not deleted.
Replication Conflicts
Logical replication behaves like normal DML operations, updating data even if it has been locally changed on the user node. If the replicated data violates any constraints, replication stops, a phenomenon known as conflicts.
When replicating UPDATE or DELETE operations, missing data (i.e., data to be updated/deleted no longer exists) doesn’t cause conflicts, and such operations are simply skipped.
Conflicts cause errors and abort logical replication. The logical replication management process will retry at 5-second intervals. Conflicts don’t block SQL operations on tables in the subscription set on the subscriber side. Details about conflicts can be found in the user’s server logs, and conflicts must be manually resolved by the user.
Possible Conflicts in Logs
| Conflict Mode | Replication Process | Output Log |
|---|---|---|
| Missing UPDATE/DELETE Object | Continue | No Output |
| Table/Row Lock Wait | Wait | No Output |
| Violation of Primary Key/Unique/Check Constraints | Abort | Output |
| Target Table/Column Missing | Abort | Output |
| Cannot Convert Data to Target Column Type | Abort | Output |
To resolve conflicts, you can either modify the data on the subscriber side to avoid conflicts with incoming changes, or skip transactions that conflict with existing data.
Use the subscription’s node_name and LSN position to call the pg_replication_origin_advance() function to skip transactions. The current ORIGIN position can be seen in the pg_replication_origin_status system view.
Limitations
Logical replication currently has the following limitations or missing features. These issues may be resolved in future versions.
Database schemas and DDL commands are not replicated. Existing schemas can be manually replicated using pg_dump --schema-only, and incremental schema changes need to be manually kept in sync (the schemas on both publisher and subscriber don’t need to be absolutely identical). Logical replication remains reliable for online DDL changes: after executing DDL changes in the publisher database, replicated data reaches the subscriber but replication stops due to table schema mismatch. After updating the subscriber’s schema, replication continues. In many cases, executing changes on the subscriber first can avoid intermediate errors.
Sequence data is not replicated. The data in identity columns served by sequences and SERIAL types is replicated as part of the table, but the sequences themselves remain at their initial values on the subscriber. If the subscriber is used as a read-only database, this is usually fine. However, if you plan to perform some form of switchover or failover to the subscriber database, you need to update the sequences to their latest values, either by copying the current data from the publisher (perhaps using pg_dump -t *seq*), or by determining a sufficiently high value from the table’s data content (e.g., max(id)+1000000). Otherwise, if you perform operations that obtain sequence values as identities on the new database, conflicts are likely to occur.
Logical replication supports replicating TRUNCATE commands, but special care is needed when TRUNCATE involves a group of tables linked by foreign keys. When executing a TRUNCATE operation, the group of associated tables on the publisher (through explicit listing or cascade association) will all be TRUNCATEd, but on the subscriber, tables not in the subscription set won’t be TRUNCATEd. This is logically reasonable because logical replication shouldn’t affect tables outside the replication set. But if there are tables not in the subscription set that reference tables in the subscription set through foreign keys, the TRUNCATE operation will fail.
Large objects are not replicated
Only tables can be replicated (including partitioned tables). Attempting to replicate other types of tables will result in errors (views, materialized views, foreign tables, unlogged tables). Specifically, only tables with pg_class.relkind = 'r' can participate in logical replication.
When replicating partitioned tables, replication is done by default at the child table level. By default, changes are triggered according to the leaf partitions of the partitioned table, meaning that every partition child table on the publisher needs to exist on the subscriber (of course, this partition child table on the subscriber doesn’t have to be a partition child table, it could be a partition parent table itself, or a regular table). The publication can declare whether to use the replica identity from the partition root table instead of the replica identity from the partition leaf table. This is a new feature in PostgreSQL 13 and can be specified through the publish_via_partition_root option when creating the publication.
Trigger behavior is different. Row-level triggers fire, but UPDATE OF cols type triggers don’t. Statement-level triggers only fire during initial data copying.
Logging behavior is different. Even with log_statement = 'all', SQL statements generated by replication won’t be logged.
Bidirectional replication requires extreme caution: It’s possible to have mutual publication and subscription as long as the table sets on both sides don’t overlap. But once there’s an intersection of tables, WAL infinite loops will occur.
Replication within the same instance: Logical replication within the same instance requires special caution. You must manually create logical replication slots and use existing logical replication slots when creating subscriptions, otherwise it will hang.
Only possible on primary: Currently, logical decoding from physical replication standbys is not supported, and replication slots cannot be created on standbys, so standbys cannot be publishers. But this issue may be resolved in the future.
Architecture
Logical replication begins by taking a snapshot of the publisher’s database and copying the existing data in tables based on this snapshot. Once the copy is complete, changes (inserts, updates, deletes, etc.) on the publisher are sent to the subscriber in real-time.
Logical replication uses an architecture similar to physical replication, implemented through a walsender and apply process. The publisher’s walsender process loads the logical decoding plugin (pgoutput) and begins logical decoding of WAL logs. The Logical Decoding Plugin reads changes from WAL, filters changes according to the publication definition, transforms changes into a specific format, and transmits them using the logical replication protocol. Data is transmitted to the subscriber’s apply process using the streaming replication protocol. This process maps changes to local tables when received and reapplies these changes in transaction order.
Initial Snapshot
During initialization and data copying, tables on the subscriber side are handled by a special apply process. This process creates its own temporary replication slot and copies the existing data in tables.
Once data copying is complete, the table enters synchronization mode (pg_subscription_rel.srsubstate = 's'), which ensures that the main apply process can apply changes that occurred during the data copying period using standard logical replication methods. Once synchronization is complete, control of table replication is transferred back to the main apply process, returning to normal replication mode.
Process Structure
The publisher creates a corresponding walsender process for each connection from the subscriber, sending decoded WAL logs. On the subscriber side, it creates an apply process to receive and apply changes.
Replication Slots
When creating a subscription, a logical replication slot is created on the publisher. This slot ensures that WAL logs are retained until they are successfully applied on the subscriber.
Logical Decoding
Logical decoding is the process of converting WAL records into a format that can be understood by logical replication. The pgoutput plugin is the default logical decoding plugin in PostgreSQL.
Synchronous Commit
Synchronous commit in logical replication is completed through SIGUSR1 communication between Backend and Walsender.
Temporary Data
Temporary data from logical decoding is written to disk as local log snapshots. When the walsender receives a SIGUSR1 signal from the walwriter, it reads WAL logs and generates corresponding logical decoding snapshots. These snapshots are deleted when transmission ends.
The file location is: $PGDATA/pg_logical/snapshots/{LSN Upper}-{LSN Lower}.snap
Monitoring
Logical replication uses an architecture similar to physical stream replication, so monitoring a logical replication publisher node is not much different from monitoring a physical replication primary.
Subscriber monitoring information can be obtained through the pg_stat_subscription view.
pg_stat_subscription Subscription Statistics Table
Each active subscription will have at least one record in this view, representing the Main Worker (responsible for applying logical logs).
The Main Worker has relid = NULL. If there are processes responsible for initial data copying, they will also have a record here, with relid being the table being copied.
subid                 | 20421
subname               | pg_test_sub
pid                   | 5261
relid                 | NULL
received_lsn          | 0/2A4F6B8
last_msg_send_time    | 2021-02-22 17:05:06.578574+08
last_msg_receipt_time | 2021-02-22 17:05:06.583326+08
latest_end_lsn        | 0/2A4F6B8
latest_end_time       | 2021-02-22 17:05:06.578574+08
received_lsn: The most recently received log position.latest_end_lsn: The last LSN position reported to the walsender, i.e., theconfirmed_flush_lsnon the primary. However, this value is not updated very frequently.
Typically, an active subscription will have an apply process running, while disabled or crashed subscriptions won’t have records in this view. During initial synchronization, synchronized tables will have additional worker process records.
pg_replication_slot Replication Slots
postgres@meta:5432/meta=# table pg_replication_slots ;
-[ RECORD 1 ]-------+------------
slot_name           | pg_test_sub
plugin              | pgoutput
slot_type           | logical
datoid              | 19355
database            | meta
temporary           | f
active              | t
active_pid          | 89367
xmin                | NULL
catalog_xmin        | 1524
restart_lsn         | 0/2A08D40
confirmed_flush_lsn | 0/2A097F8
wal_status          | reserved
safe_wal_size       | NULL
The replication slots view contains both logical and physical replication slots. The main characteristics of logical replication slots are:
pluginfield is not empty, identifying the logical decoding plugin used. Logical replication defaults to using thepgoutputplugin.slot_type = logical, while physical replication slots are of typephysical.datoidanddatabasefields are not empty because physical replication is associated with the cluster, while logical replication is associated with the database.
Logical subscribers also appear as standard replication standbys in the pg_stat_replication view.
pg_replication_origin Replication Origin
Replication origin
table pg_replication_origin_status;
-[ RECORD 1 ]-----------
local_id    | 1
external_id | pg_19378
remote_lsn  | 0/0
local_lsn   | 0/6BB53640
local_id: The local ID of the replication origin, represented efficiently in 2 bytes.external_id: The ID of the replication origin, which can be referenced across nodes.remote_lsn: The most recent commit position on the source.local_lsn: The LSN of locally persisted commit records.
Detecting Replication Conflicts
The most reliable method of detection is always from the logs on both publisher and subscriber sides. When replication conflicts occur, you can see replication connection interruptions on the publisher:
LOG:  terminating walsender process due to replication timeout
LOG:  starting logical decoding for slot "pg_test_sub"
DETAIL:  streaming transactions committing after 0/xxxxx, reading WAL from 0/xxxx
While on the subscriber side, you can see the specific cause of the replication conflict, for example:
logical replication worker PID 4585 exited with exit code 1
ERROR: duplicate key value violates unique constraint "pgbench_tellers_pkey","Key (tid)=(9) already exists.",,,,"COPY pgbench_tellers, line 31",,,,"","logical replication worker"
Additionally, some monitoring metrics can reflect the state of logical replication:
For example: pg_replication_slots.confirmed_flush_lsn consistently lagging behind pg_cureent_wal_lsn. Or significant growth in pg_stat_replication.flush_ag/write_lag.
Security
Tables participating in subscriptions must have their Ownership and Trigger permissions controlled by roles trusted by the superuser (otherwise, modifying these tables could cause logical replication to stop).
On the publisher node, if untrusted users have table creation permissions, publications should explicitly specify table names rather than using the wildcard ALL TABLES. That is, FOR ALL TABLES should only be used when the superuser trusts all users who have permission to create tables (non-temporary) on either the publisher or subscriber side.
The user used for replication connections must have the REPLICATION permission (or be a SUPERUSER). If this role lacks SUPERUSER and BYPASSRLS, row security policies on the publisher may be executed. If the table owner sets row-level security policies after replication starts, this configuration may cause replication to stop directly rather than the policy taking effect. The user must have LOGIN permission, and HBA rules must allow access.
To be able to replicate initial table data, the role used for replication connections must have SELECT permission on the published tables (or be a superuser).
Creating a publication requires CREATE permission in the database, and creating a FOR ALL TABLES publication requires superuser permission.
Adding tables to a publication requires owner permission on the tables.
Creating a subscription requires superuser permission because the subscription’s apply process runs with superuser privileges in the local database.
Permissions are only checked when establishing the replication connection, not when reading each change record on the publisher side, nor when applying each record on the subscriber side.
Configuration Options
Logical replication requires some configuration options to work properly.
On the publisher side, wal_level must be set to logical, max_replication_slots needs to be at least the number of subscriptions + the number used for table data synchronization. max_wal_senders needs to be at least max_replication_slots + the number reserved for physical replication.
On the subscriber side, max_replication_slots also needs to be set, with max_replication_slots needing to be at least the number of subscriptions.
max_logical_replication_workers needs to be configured to at least the number of subscriptions, plus some for data synchronization worker processes.
Additionally, max_worker_processes needs to be adjusted accordingly, at least to max_logical_replication_worker + 1. Note that some extensions and parallel queries will also use connections from the worker process pool.
Configuration Parameter Example
For a 64-core machine with 1-2 publications and subscriptions, up to 6 synchronization worker processes, and up to 8 physical standbys, a sample configuration might look like this:
First, determine the number of slots: 2 subscriptions, 6 synchronization worker processes, 8 physical standbys, so configure for 16. Sender = Slot + Physical Replica = 24.
Limit synchronization worker processes to 6, 2 subscriptions, so set the total logical replication worker processes to 8.
wal_level: logical                      # logical
max_worker_processes: 64                # default 8 -> 64, set to CPU CORE 64
max_parallel_workers: 32                # default 8 -> 32, limit by max_worker_processes
max_parallel_maintenance_workers: 16    # default 2 -> 16, limit by parallel worker
max_parallel_workers_per_gather: 0      # default 2 -> 0,  disable parallel query on OLTP instance
# max_parallel_workers_per_gather: 16   # default 2 -> 16, enable parallel query on OLAP instance

max_wal_senders: 24                     # 10 -> 24
max_replication_slots: 16               # 10 -> 16
max_logical_replication_workers: 8      # 4 -> 8, 6 sync worker + 1~2 apply worker
max_sync_workers_per_subscription: 6    # 2 -> 6, 6 sync worker
Quick Setup
First, set the configuration option wal_level = logical on the publisher side. This parameter requires a restart to take effect. Other parameters’ default values don’t affect usage.
Then create a replication user and add pg_hba.conf configuration items to allow external access. A typical configuration is:
CREATE USER replicator REPLICATION BYPASSRLS PASSWORD 'DBUser.Replicator';
Note that logical replication users need SELECT permission. In Pigsty, replicator has already been granted the dbrole_readonly role.
host     all          replicator     0.0.0.0/0     md5
host     replicator   replicator     0.0.0.0/0     md5
Then execute in the publisher’s database:
CREATE PUBLICATION mypub FOR TABLE <tablename>;
Then execute in the subscriber’s database:
CREATE SUBSCRIPTION mysub CONNECTION 'dbname=<pub_db> host=<pub_host> user=replicator' PUBLICATION mypub;
The above configuration will start replication, first copying the initial data of the tables, then beginning to synchronize incremental changes.
Sandbox Example
Using the Pigsty standard 4-node two-cluster sandbox as an example, there are two database clusters pg-meta and pg-test. Now we’ll use pg-meta-1 as the publisher and pg-test-1 as the subscriber.
PGSRC='postgres://dbuser_admin@meta-1/meta'           # Publisher
PGDST='postgres://dbuser_admin@node-1/test'           # Subscriber
pgbench -is100 ${PGSRC}                               # Initialize Pgbench on publisher
pg_dump -Oscx -t pgbench* -s ${PGSRC} | psql ${PGDST} # Sync table structure on subscriber

# Create a **publication** on the publisher, adding default `pgbench` related tables to the publication set.
psql ${PGSRC} -AXwt <<-'EOF'
CREATE PUBLICATION "pg_meta_pub" FOR TABLE
  pgbench_accounts,pgbench_branches,pgbench_history,pgbench_tellers;
EOF

# Create a **subscription** on the subscriber, subscribing to the publisher's publication.
psql ${PGDST} <<-'EOF'
CREATE SUBSCRIPTION pg_test_sub
  CONNECTION 'host=10.10.10.10 dbname=meta user=replicator'
  PUBLICATION pg_meta_pub;
EOF
Replication Process
After the subscription creation, if everything is normal, logical replication will automatically start, executing the replication state machine logic for each table in the subscription.
As shown in the following figure.
When all tables are completed and enter r (ready) state, the logical replication’s existing data synchronization stage is completed, and the publisher and subscriber sides enter synchronization state as a whole.
Therefore, logically speaking, there are two state machines: Table Level Replication Small State Machine and Global Replication Large State Machine. Each Sync Worker is responsible for a small state machine on one table, while an Apply Worker is responsible for a logical replication large state machine.
Logical Replication State Machine
Logical replication has two Workers: Sync and Apply. Sync
Therefore, logical replication is logically divided into two parts: Each Table Independently Replicating,When the replication progress catches up to the latest position, by
When creating or refreshing a subscription, the table will be added to the subscription set, and each table in the subscription set will have a corresponding record in the pg_subscription_rel view, showing the current replication status of this table. The newly added table is initially in i,即initialize,Initial State.
If the subscription’s copy_data option is true (default),And there is an idle Worker in the worker pool, PostgreSQL will allocate a synchronization worker for this table, synchronize the existing data on this table, and the table state enters d,即Copying Data. Synchronizing table data is similar to basebackup for database cluster, Sync Worker will create a temporary replication slot on the publisher, get the snapshot of the table through COPY, and complete basic data synchronization.
When the basic data copy of the table is completed, the table will enter sync mode, that is, Data Synchronization, the synchronization process will catch up with incremental changes during synchronization. When the catch-up is complete, the synchronization process will mark this table as r (ready) state, turn over the management of changes to the logical replication main Apply process, indicating that this table is in normal replication.
2.4 Waiting for Logical Replication Synchronization
After creating a subscription, first must monitor Ensure no errors are generated on both publisher and subscriber sides’ database logs.
2.4.1 Logical Replication State Machine
2.4.2 Synchronization Progress Tracking
Data synchronization (d) stage may take some time, depending on network card, network, disk, table size and distribution, logical replication synchronization worker quantity factors.
As a reference, 1TB database, 20 tables, containing 250GB large table, dual 10G network card, under the responsibility of 6 data synchronization workers, it takes about 6~8 hours to complete replication.
During data synchronization, each table synchronization task will create a temporary replication slot on the source end. Please ensure that logical replication initial synchronization period does not put unnecessary write pressure on the source primary, so as not to cause WAL to burst disk.
pg_stat_replication,pg_replication_slots,subscriber’s pg_stat_subscription,pg_subscription_rel provide logical replication status related information, need to pay attention.
Query Optimization: The Macro Approach with pg_stat_statements
In production databases, slow queries not only impact end-user experience but also waste system resources, increase resource saturation, cause deadlocks and transaction conflicts, add pressure to database connections, and lead to replication lag. Therefore, query optimization is one of the core responsibilities of DBAs.
There are two distinct approaches to query optimization:
Macro Optimization: Analyze the overall workload, break it down, and identify and improve the worst-performing components from top to bottom.
Micro Optimization: Analyze and improve specific queries, which requires slow query logging, mastering EXPLAIN, and understanding execution plans.
Today, let’s focus on the former. Macro optimization has three main objectives:
Reduce Resource Consumption: Lower the risk of resource saturation, optimize CPU/memory/IO, typically targeting total query execution time/IO.
Improve User Experience: The most common optimization goal, typically measured by reducing average query response time in OLTP systems.
Balance Workload: Ensure proper resource usage/performance ratios between different query groups.
The key to achieving these goals lies in data support, but where does this data come from?
— pg_stat_statements!

The Extension: PGSS
pg_stat_statements, hereafter referred to as PGSS, is the core tool for implementing the macro approach.
PGSS is developed by the PostgreSQL Global Development Group, distributed as a first-party extension alongside the database kernel. It provides methods for tracking SQL query-level metrics.
Among the many PostgreSQL extensions, if there’s one that’s “essential”, I would unhesitatingly answer: PGSS. This is why in Pigsty, we prefer to “take matters into our own hands” and enable this extension by default, along with auto_explain for micro-optimization.
PGSS needs to be explicitly loaded in shared_preload_library and created in the database via CREATE EXTENSION. After creating the extension, you can access query statistics through the pg_stat_statements view.
In PGSS, each query type (i.e., queries with the same execution plan after variable extraction) is assigned a query ID, followed by call count, total execution time, and various other metrics. The complete schema definition is as follows (PG15+):
CREATE TABLE pg_stat_statements
(
    userid                 OID,     -- (Label) OID of user executing this statement
    dbid                   OID,     -- (Label) OID of database containing this statement
    toplevel               BOOL,    -- (Label) Whether this is a top-level SQL statement
    queryid                BIGINT,  -- (Label) Query ID: hash of normalized query
    query                  TEXT,    -- (Label) Text of normalized query statement
    plans                  BIGINT,  -- (Counter) Number of times this statement was planned
    total_plan_time        FLOAT,   -- (Counter) Total time spent planning this statement
    min_plan_time          FLOAT,   -- (Gauge) Minimum planning time
    max_plan_time          FLOAT,   -- (Gauge) Maximum planning time
    mean_plan_time         FLOAT,   -- (Gauge) Average planning time
    stddev_plan_time       FLOAT,   -- (Gauge) Standard deviation of planning time
    calls                  BIGINT,  -- (Counter) Number of times this statement was executed
    total_exec_time        FLOAT,   -- (Counter) Total time spent executing this statement
    min_exec_time          FLOAT,   -- (Gauge) Minimum execution time
    max_exec_time          FLOAT,   -- (Gauge) Maximum execution time
    mean_exec_time         FLOAT,   -- (Gauge) Average execution time
    stddev_exec_time       FLOAT,   -- (Gauge) Standard deviation of execution time
    rows                   BIGINT,  -- (Counter) Total rows returned by this statement
    shared_blks_hit        BIGINT,  -- (Counter) Total shared buffer blocks hit
    shared_blks_read       BIGINT,  -- (Counter) Total shared buffer blocks read
    shared_blks_dirtied    BIGINT,  -- (Counter) Total shared buffer blocks dirtied
    shared_blks_written    BIGINT,  -- (Counter) Total shared buffer blocks written to disk
    local_blks_hit         BIGINT,  -- (Counter) Total local buffer blocks hit
    local_blks_read        BIGINT,  -- (Counter) Total local buffer blocks read
    local_blks_dirtied     BIGINT,  -- (Counter) Total local buffer blocks dirtied
    local_blks_written     BIGINT,  -- (Counter) Total local buffer blocks written to disk
    temp_blks_read         BIGINT,  -- (Counter) Total temporary buffer blocks read
    temp_blks_written      BIGINT,  -- (Counter) Total temporary buffer blocks written to disk
    blk_read_time          FLOAT,   -- (Counter) Total time spent reading blocks
    blk_write_time         FLOAT,   -- (Counter) Total time spent writing blocks
    wal_records            BIGINT,  -- (Counter) Total number of WAL records generated
    wal_fpi                BIGINT,  -- (Counter) Total number of WAL full page images generated
    wal_bytes              NUMERIC, -- (Counter) Total number of WAL bytes generated
    jit_functions          BIGINT,  -- (Counter) Number of JIT-compiled functions
    jit_generation_time    FLOAT,   -- (Counter) Total time spent generating JIT code
    jit_inlining_count     BIGINT,  -- (Counter) Number of times functions were inlined
    jit_inlining_time      FLOAT,   -- (Counter) Total time spent inlining functions
    jit_optimization_count BIGINT,  -- (Counter) Number of times queries were JIT-optimized
    jit_optimization_time  FLOAT,   -- (Counter) Total time spent on JIT optimization
    jit_emission_count     BIGINT,  -- (Counter) Number of times code was JIT-emitted
    jit_emission_time      FLOAT,   -- (Counter) Total time spent on JIT emission
    PRIMARY KEY (userid, dbid, queryid, toplevel)
);
PGSS View SQL Definition (PG 15+ version)
PGSS has some limitations: First, currently executing queries are not included in these statistics and need to be viewed from pg_stat_activity. Second, failed queries (e.g., statements canceled due to statement_timeout) are not counted in these statistics — this is a problem for error analysis, not query optimization.
Finally, the stability of the query identifier queryid requires special attention: When the database binary version and system data directory are identical, the same query type will have the same queryid (i.e., on physical replication primary and standby, query types have the same queryid by default), but this is not the case for logical replication. However, users should not rely too heavily on this property.
Raw Data
The columns in the PGSS view can be categorized into three types:
Descriptive Label Columns: Query ID (queryid), database ID (dbid), user (userid), a top-level query flag, and normalized query text (query).
Measured Metrics (Gauge): Eight statistical columns related to minimum, maximum, mean, and standard deviation, prefixed with min, max, mean, stddev, and suffixed with plan_time and exec_time.
Cumulative Metrics (Counter): All other metrics except the above eight columns and label columns, such as calls, rows, etc. The most important and useful metrics are in this category.
First, let’s explain queryid: queryid is the hash value of a normalized query after parsing and constant stripping, so it can be used to identify the same query type. Different query statements may have the same queryid (same structure after normalization), and the same query statement may have different queryids (e.g., due to different search_path, leading to different actual tables being queried).
The same query might be executed by different users in different databases. Therefore, in the PGSS view, the four label columns queryid, dbid, userid, and toplevel together form the “primary key” that uniquely identifies a record.
For metric columns, measured metrics (GAUGE) are mainly the eight statistics related to execution time and planning time. However, users cannot effectively control the statistical range of these metrics, so their practical value is limited.
The truly important metrics are cumulative metrics (Counter), such as:
calls: Number of times this query group was called.
total_exec_time + total_plan_time: Total time spent by the query group.
rows: Total rows returned by the query group.
shared_blks_hit + shared_blks_read: Total number of buffer pool hit and read operations.
wal_bytes: Total WAL bytes generated by queries in this group.
blk_read_time and blk_write_time: Total time spent on block I/O operations.
Here, the most meaningful metrics are calls and total_exec_time, which can be used to calculate the query group’s core metrics QPS (throughput) and RT (latency/response time), but other metrics are also valuable references.
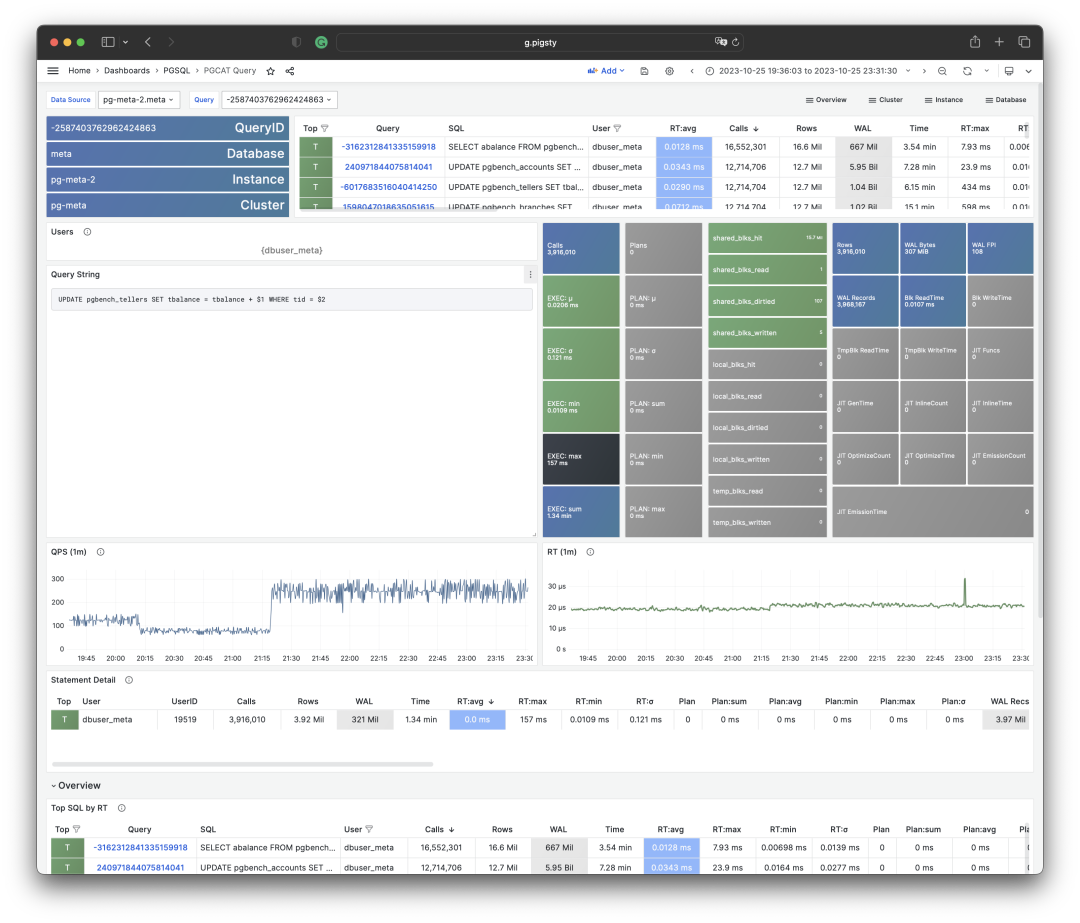
Visualization of a query group snapshot from the PGSS view
To interpret cumulative metrics, data from a single point in time is insufficient. We need to compare at least two snapshots to draw meaningful conclusions.
As a special case, if your area of interest happens to be from the beginning of the statistical period (usually when the extension was enabled) to the present, then you indeed don’t need to compare “two snapshots”. But users’ time granularity of interest is usually not this coarse, often being in minutes, hours, or days.
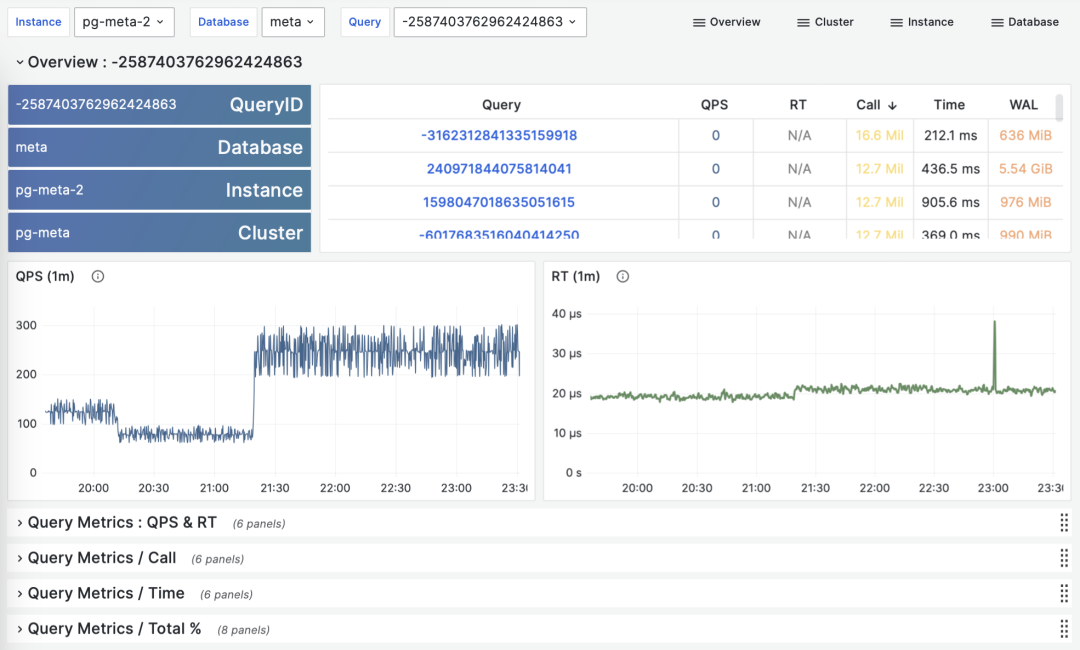
Calculating historical time-series metrics based on multiple PGSS query group snapshots
Fortunately, tools like Pigsty monitoring system regularly (default every 10s) capture snapshots of top queries (Top256 by execution time). With many different types of cumulative metrics (Metrics) at different time points, we can calculate three important derived metrics for any cumulative metric:
dM/dt: The time derivative of metric M, i.e., the increment per second.
dM/dc: The derivative of metric M with respect to call count, i.e., the average increment per call.
%M: The percentage of metric M in the entire workload.
These three types of metrics correspond exactly to the three objectives of macro optimization. The time derivative dM/dt reveals resource usage per second, typically used for the objective of reducing resource consumption. The call derivative dM/dc reveals resource usage per call, typically used for the objective of improving user experience. The percentage metric %M shows the proportion of a query group in the entire workload, typically used for the objective of balancing workload.
Time Derivatives
Let’s first look at the first type of metric: time derivatives. Here, we can use metrics M including: calls, total_exec_time, rows, wal_bytes, shared_blks_hit + shared_blks_read, and blk_read_time + blk_write_time. Other metrics are also valuable references, but let’s start with the most important ones.
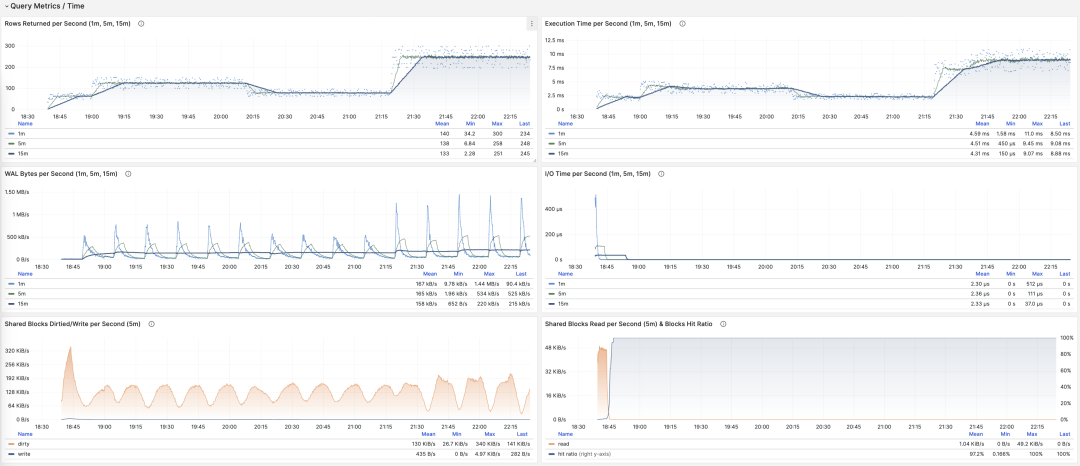
Visualization of time derivative metrics dM/dt
The calculation of these metrics is quite simple:
- First, calculate the difference in metric value M between two snapshots: M2 - M1
- Then, calculate the time difference between two snapshots: t2 - t1
- Finally, calculate (M2 - M1) / (t2 - t1)
Production environments typically use sampling intervals of 5s, 10s, 15s, 30s, 60s. For workload analysis, 1m, 5m, 15m are commonly used as analysis window sizes.
For example, when calculating QPS, we calculate QPS for the last 1 minute, 5 minutes, and 15 minutes respectively. Longer windows result in smoother curves, better reflecting long-term trends; but they hide short-term fluctuation details, making it harder to detect instant anomalies. Therefore, metrics of different granularities need to be considered together.
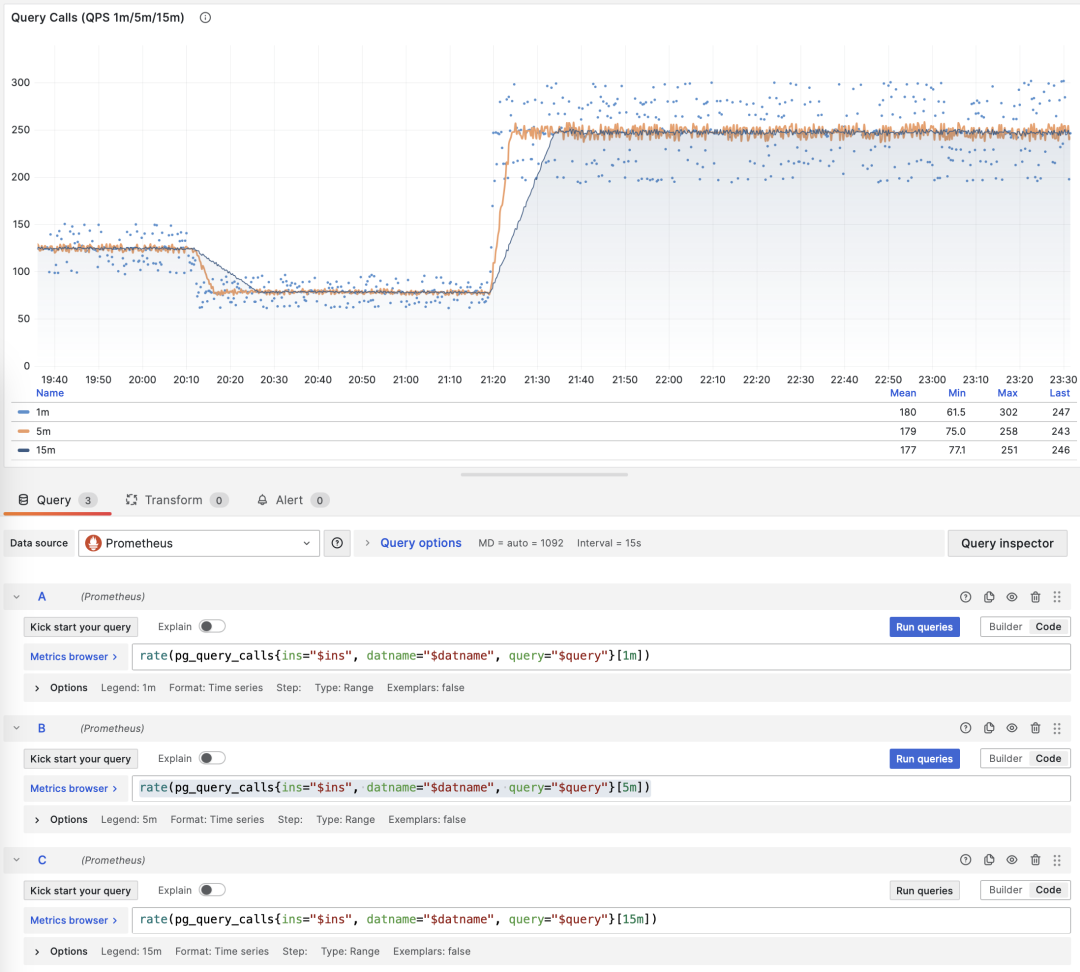
Showing QPS for a specific query group in 1/5/15 minute windows
If you use Pigsty / Prometheus to collect monitoring data, you can easily perform these calculations using PromQL. For example, to calculate the QPS metric for all queries in the last minute, you can use: rate(pg_query_calls{}[1m])
QPS
When M is calls, the time derivative is QPS, with units of queries per second (req/s). This is a very fundamental metric. Query QPS is a throughput metric that directly reflects the load imposed by the business. If a query’s throughput is too high (e.g., 10000+) or too low (e.g., 1-), it might be worth attention.
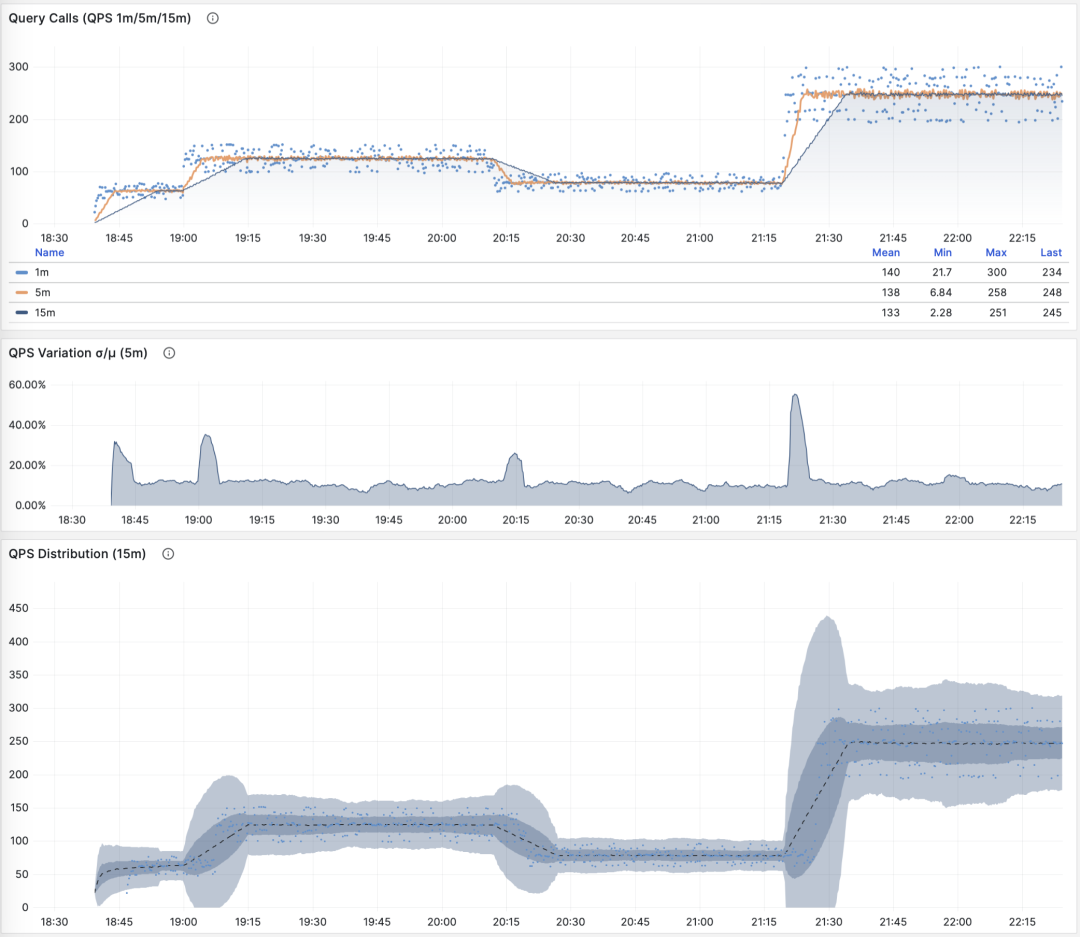
QPS: 1/5/15 minute µ/CV, ±1/3σ distribution
If we sum up the QPS metrics of all query groups (and haven’t exceeded PGSS’s collection range), we get the so-called “global QPS”. Another way to obtain global QPS is through client-side instrumentation, collection at connection pool middleware like Pgbouncer, or using ebpf probes. But none are as convenient as PGSS.
Note that QPS metrics don’t have horizontal comparability in terms of load. Different query groups may have the same QPS, while individual query execution times may vary dramatically. Even the same query group may produce vastly different load levels at different time points due to execution plan changes. Execution time per second is a better metric for measuring load.
Execution Time Per Second
When M is total_exec_time (+ total_plan_time, optional), we get one of the most important metrics in macro optimization: execution time spent on the query group. Interestingly, the units of this derivative are seconds per second, so the numerator and denominator cancel out, making it actually a dimensionless metric.
This metric’s meaning is: how many seconds per second the server spends processing queries in this group. For example, 2 s/s means the server spends two seconds of execution time per second on this group of queries; for multi-core CPUs, this is certainly possible: just use all the time of two CPU cores.

Execution time per second: 1/5/15 minute mean
Therefore, this value can also be understood as a percentage: it can exceed 100%. From this perspective, it’s a metric similar to host load1, load5, load15, revealing the load level produced by this query group. If divided by the number of CPU cores, we can even get a normalized query load contribution metric.
However, we need to note that execution time includes time spent waiting for locks and I/O. So it’s indeed possible that a query has a long execution time but doesn’t impact CPU load. Therefore, for detailed analysis of slow queries, we need to further analyze with reference to wait events.
Rows Per Second
When M is rows, we get the number of rows returned per second by this query group, with units of rows per second (rows/s). For example, 10000 rows/s means this type of query returns 10,000 rows of data to the client per second. Returned rows consume client processing resources, making this a very valuable reference metric when we need to examine application client data processing pressure.

Rows returned per second: 1/5/15 minute mean
Shared Buffer Access Bandwidth
When M is shared_blks_hit + shared_blks_read, we get the number of shared buffer blocks hit/read per second. If we multiply this by the default block size of 8KiB (rarely might be other sizes, e.g., 32KiB), we get the bandwidth of a query type “accessing” memory/disk: units are bytes per second.
For example, if a certain query type accesses 500,000 shared buffer blocks per second, equivalent to 3.8 GiB/s of internal access data flow: then this is a significant load, and might be a good candidate for optimization. You should probably check this query to see if it deserves these “resource consumption”.

Shared buffer access bandwidth and buffer hit rate
Another valuable derived metric is buffer hit rate: hit / (hit + read), which can be used to analyze possible causes of performance changes — cache misses. Of course, repeated access to the same shared buffer pool block doesn’t actually result in a new read, and even if it does read, it might not be from disk but from memory in FS Cache. So this is just a reference value, but it is indeed a very important macro query optimization reference metric.
WAL Log Volume
When M is wal_bytes, we get the rate at which this query generates WAL, with units of bytes per second (B/s). This metric was newly introduced in PostgreSQL 13 and can be used to quantitatively reveal the WAL size generated by queries: the more and faster WAL is written, the greater the pressure on disk flushing, physical/logical replication, and log archiving.
A typical example is: BEGIN; DELETE FROM xxx; ROLLBACK;. Such a transaction deletes a lot of data, generates a large amount of WAL, but performs no useful work. This metric can help identify such cases.

WAL bytes per second: 1/5/15 minute mean
There are two things to note here: As mentioned above, PGSS cannot track failed statements, but here the transaction was ROLLBACKed, but the statements were successfully executed, so they are tracked by PGSS.
The second thing is: in PostgreSQL, not only INSERT/UPDATE/DELETE operations generate WAL logs, SELECT operations might also generate WAL logs, because SELECT might modify tuple marks (Hint Bit) causing page checksums to change, triggering WAL log writes.
There’s even the possibility that if the read load is very large, it might have a higher probability of causing FPI image generation, producing considerable WAL log volume. You can check this further through the wal_fpi metric.
Shared buffer dirty/write-back bandwidth
For versions below 13, shared buffer dirty/write-back bandwidth metrics can serve as approximate alternatives for analyzing write load characteristics of query groups.
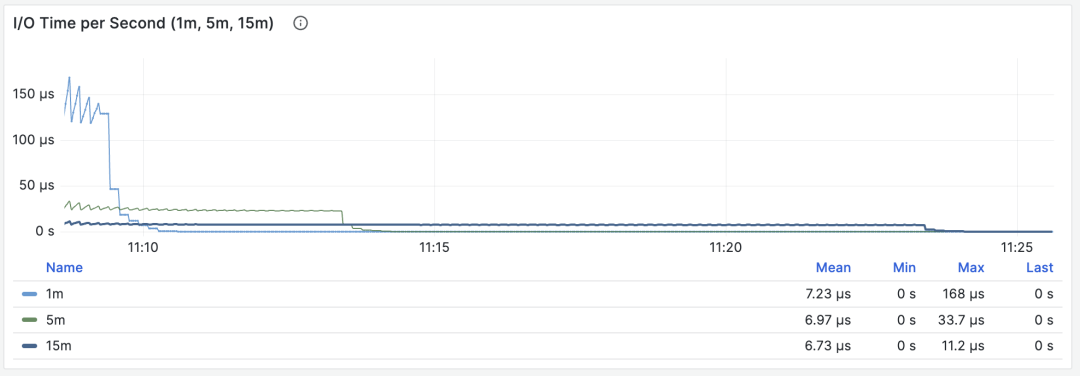
I/O Time
When M is blks_read_time + blks_write_time, we get the proportion of time spent on block I/O by the query group, with units of “seconds per second”, same as the execution time per second metric, it also reflects the proportion of time occupied by such operations.
I/O time is helpful for analyzing query spike causes
Because PostgreSQL uses the operating system’s FS Cache, even if block reads/writes are performed here, they might still be buffer operations at the filesystem level. So this can only be used as a reference metric, requiring careful use and comparison with disk I/O monitoring on the host node.
Time derivative metrics dM/dt can reveal the complete picture of workload within a database instance/cluster, especially useful for scenarios aiming to optimize resource usage. But if your optimization goal is to improve user experience, then another set of metrics — call derivatives dM/dc — might be more relevant.
Call Derivatives
Above we’ve calculated time derivatives for six important metrics. Another type of derived metric calculates derivatives with respect to “call count”, where the denominator changes from time difference to QPS.
This type of metric is even more important than the former, as it provides several core metrics directly related to user experience, such as the most important — Query Response Time (RT), or Latency.
The calculation of these metrics is also simple:
- Calculate the difference in metric value M between two snapshots: M2 - M1
- Then calculate the difference in calls between two snapshots: c2 - c1
- Finally calculate (M2 - M1) / (c2 - c1)
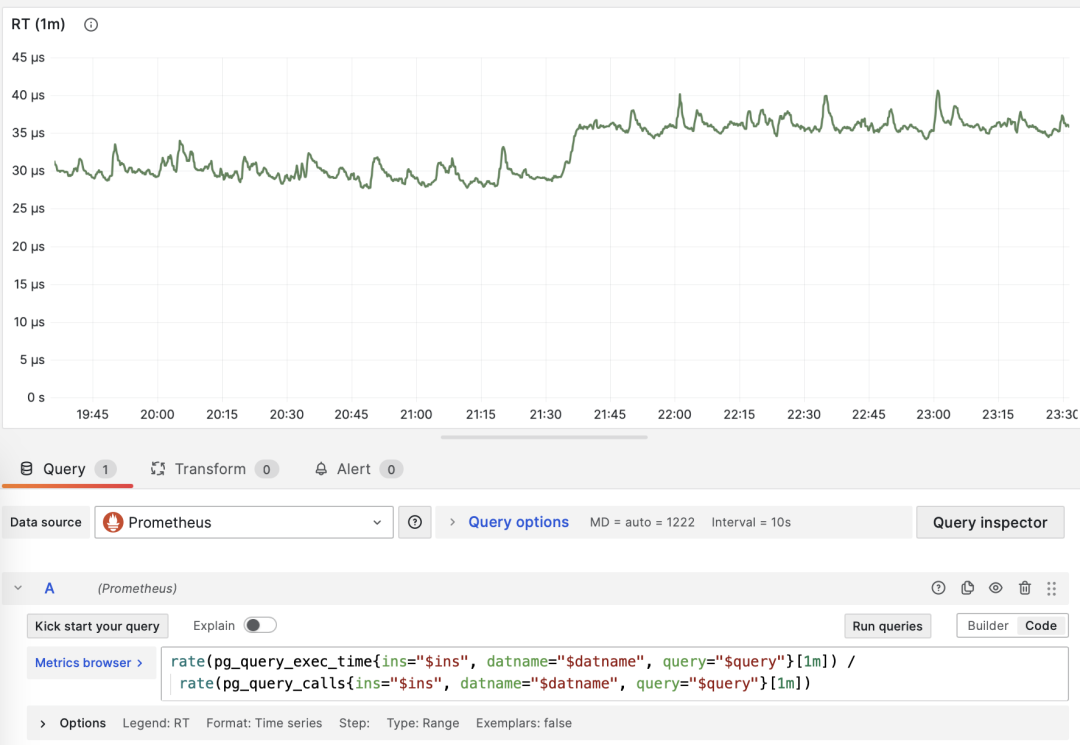
For PromQL implementation, call derivative metrics dM/dc can be calculated from “time derivative metrics dM/dt”. For example, to calculate RT, you can use execution time per second / queries per second, dividing the two metrics:
rate(pg_query_exec_time{}[1m]) / rate(pg_query_calls{}[1m])
dM/dt can be used to calculate dM/dc
Call Count
When M is calls, taking its own derivative is meaningless (result will always be 1).
Average Latency/Response Time/RT
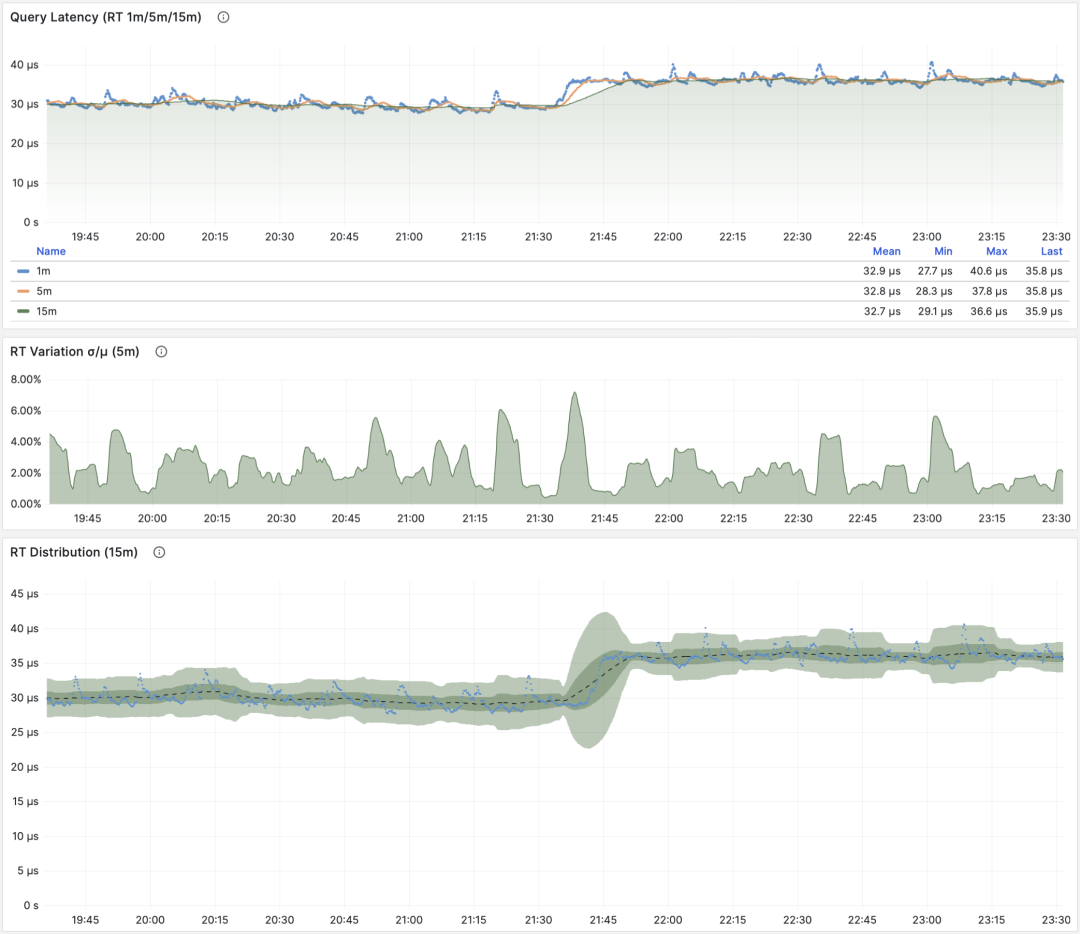
When M is total_exec_time, the call derivative is RT, or response time/latency. Its unit is seconds (s). RT directly reflects user experience and is the most important metric in macro performance analysis. This metric’s meaning is: the average query response time of this query group on the server. If conditions allow enabling pg_stat_statements.track_planning, you can also add total_plan_time to the calculation for more precise and representative results.

RT: statement level/connection pool level/database level
Unlike throughput metrics like QPS, RT has horizontal comparability: for example, if a query group’s RT is normally within 1 millisecond, then events exceeding 10ms should be considered serious deviations for analysis.
When failures occur, RT views are also helpful for root cause analysis: if all queries’ overall RT slows down, it’s most likely related to insufficient resources. If only specific query groups’ RT changes, it’s more likely that some slow queries are causing problems and should be further investigated. If RT changes coincide with application deployment, you should consider rolling back these deployments.
Moreover, in performance analysis, stress testing, and benchmarking, RT is the most important metric. You can evaluate system performance by comparing typical queries’ latency performance in different environments (e.g., different PG versions, hardware, configuration parameters) and use this as a basis for continuous system performance adjustment and improvement.
RT is so important that RT itself spawns many downstream metrics: 1-minute/5-minute/15-minute means µ and standard deviations σ are naturally essential; past 15 minutes’ ±σ, ±3σ can be used to measure RT fluctuation range, and past 1 hour’s 95th, 99th percentiles are also valuable references.
RT is the core metric for evaluating OLTP workloads, and its importance cannot be overemphasized.
Average Rows Returned
When M is rows, we get the average rows returned per query, with units of rows per query. For OLTP workloads, typical query patterns are point queries, returning a few rows of data per query.

Querying single record by primary key, average rows returned stable at 1
If a query group returns hundreds or even thousands of rows to the client per query, it should be examined. If this is by design, like batch loading tasks/data dumps, then no action is needed. If this is initiated by the application/client, there might be errors, such as statements missing LIMIT restrictions, queries lacking pagination design. Such queries should be adjusted and fixed.
Average Shared Buffer Reads/Hits
When M is shared_blks_hit + shared_blks_read, we get the average number of shared buffer “hits” and “reads” per query. If we multiply this by the default block size of 8KiB, we get this query type’s “bandwidth” per execution, with units of B/s: how many MB of data does each query access/read on average?
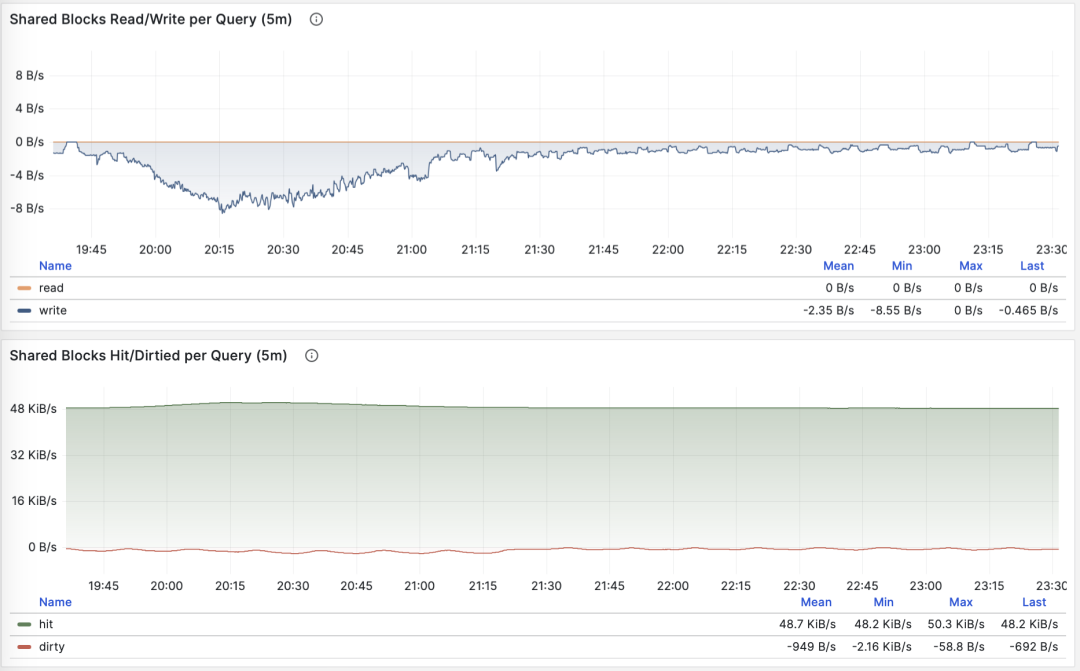
Querying single record by primary key, average rows returned stable at 1
The average data accessed by a query typically matches the average rows returned. If your query returns only a few rows on average but accesses megabytes or gigabytes of data blocks, you need to pay special attention: such queries are very sensitive to data hot/cold state. If all blocks are in the buffer, its performance might be acceptable, but if starting cold from disk, execution time might change dramatically.
Of course, don’t forget PostgreSQL’s double caching issue. The so-called “read” data might have already been cached once at the operating system filesystem level. So you need to cross-reference with operating system monitoring metrics, or system views like pg_stat_kcache, pg_stat_io for analysis.
Another pattern worth attention is sudden changes in this metric, which usually means the query group’s execution plan might have flipped/degraded, very worthy of attention and further research.
Average WAL Log Volume
When M is wal_bytes, we get the average WAL size generated per query, a field newly introduced in PostgreSQL 13. This metric can measure a query’s change footprint size and calculate important evaluation parameters like read/write ratios.

Stable QPS with periodic WAL fluctuations, can infer FPI influence
Another use is optimizing checkpoints/Checkpoint: if you observe periodic fluctuations in this metric (period approximately equal to checkpoint_timeout), you can optimize the amount of WAL generated by queries by adjusting checkpoint spacing.
Call derivative metrics dM/dc can reveal a query type’s workload characteristics, very useful for optimizing user experience. Especially RT is the golden metric for performance optimization, and its importance cannot be overemphasized.
dM/dc metrics provide us with important absolute value metrics, but to find which queries have the greatest potential optimization benefits, we also need %M percentage metrics.
Percentage Metrics
Now let’s examine the third type of metric, percentage metrics. These show the proportion of a query group relative to the overall workload.
Percentage metrics M% provide us with a query group’s proportion relative to the overall workload, helping us identify “major contributors” in terms of frequency, time, I/O time/count, and find query groups with the greatest potential optimization benefits as important criteria for priority assessment.
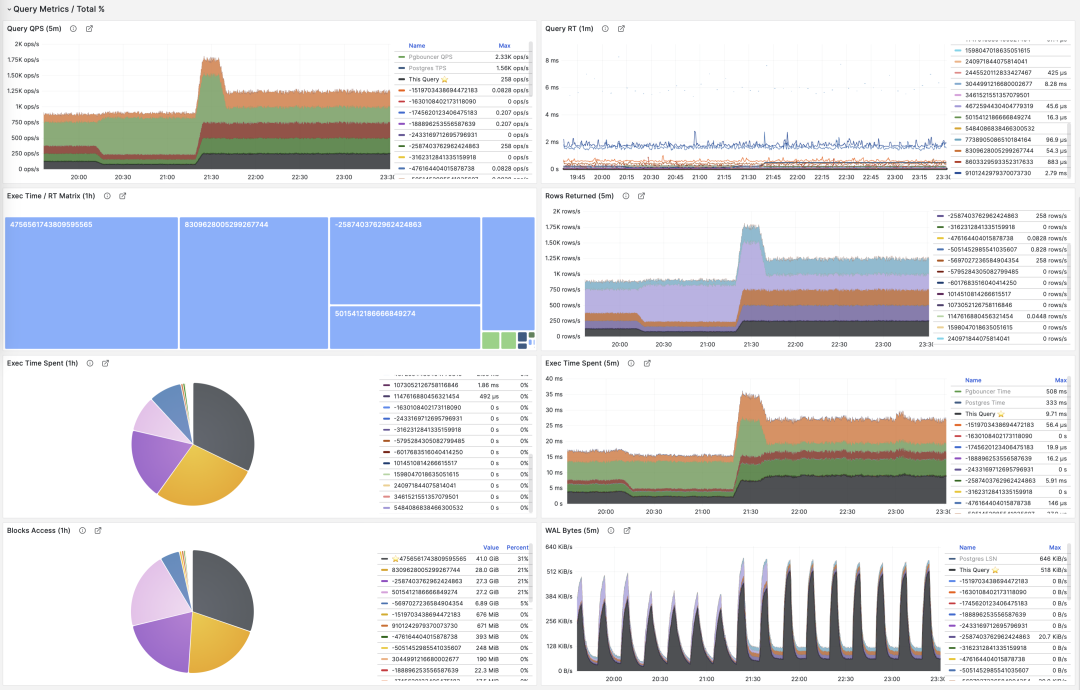
Common percentage metrics %M overview
For example, if a query group has an absolute value of 1000 QPS, it might seem significant; but if it only accounts for 3% of the entire workload, then the benefits and priority of optimizing this query aren’t that high. Conversely, if it accounts for more than 50% of the entire workload — if you can optimize it, you can cut the instance’s throughput in half, making its optimization priority very high.
A common optimization strategy is: first sort all query groups by the important metrics mentioned above: calls, total_exec_time, rows, wal_bytes, shared_blks_hit + shared_blks_read, and blk_read_time + blk_write_time over a period of time’s dM/dt values, take TopN (e.g., N=10 or more), and add them to the optimization candidate list.
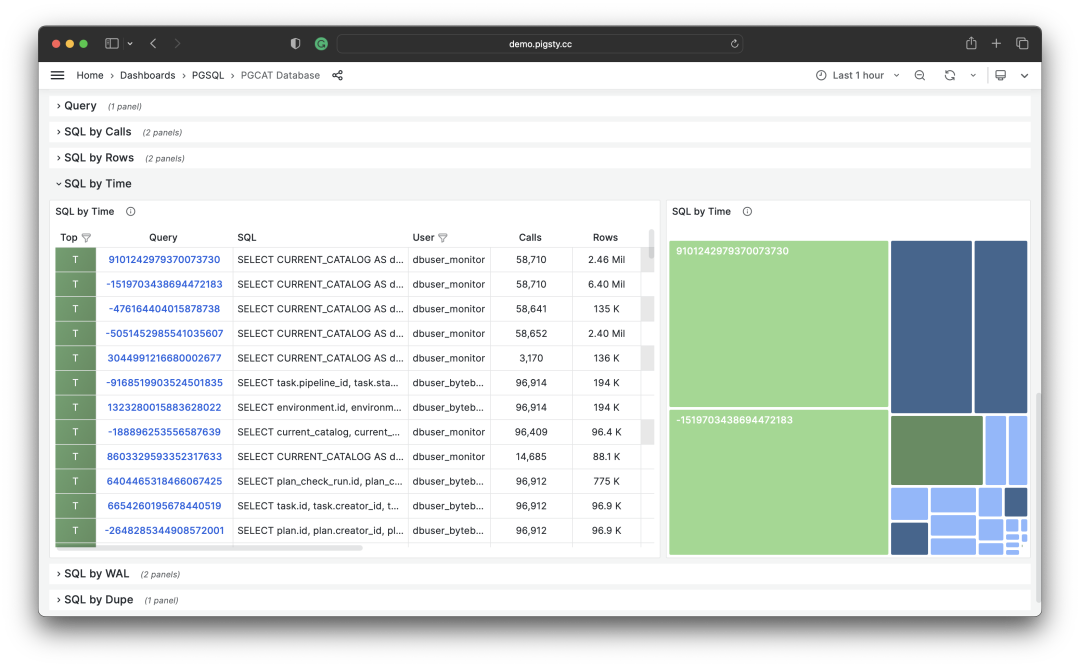
Selecting TopSQL for optimization based on specific criteria
Then, for each query group in the optimization candidate list, analyze its dM/dc metrics, combine with specific query statements and slow query logs/wait events for analysis, and decide if this is a query worth optimizing. For queries decided (Plan) to optimize, you can use the techniques to be introduced in the subsequent “Micro Optimization” article for tuning (Do), and use the monitoring system to evaluate optimization effects (Check). After summarizing and analyzing, enter the next PDCA Deming cycle, continuously managing and optimizing.
Besides taking TopN of metrics, visualization can also be used. Visualization is very helpful for identifying “major contributors” from the workload. Complex judgment algorithms might be far inferior to human DBAs’ intuition about monitoring graph patterns. To form a sense of proportion, we can use pie charts, tree maps, or stacked time series charts.

Stacking QPS of all query groups
For example, we can use pie charts to identify queries with the highest time/IO usage in the past hour, use 2D tree maps (size representing total time, color representing average RT) to show an additional dimension, and use stacked time series charts to show proportion changes over time.
We can also directly analyze the current PGSS snapshot, sort by different concerns, and select queries that need optimization according to your own criteria.
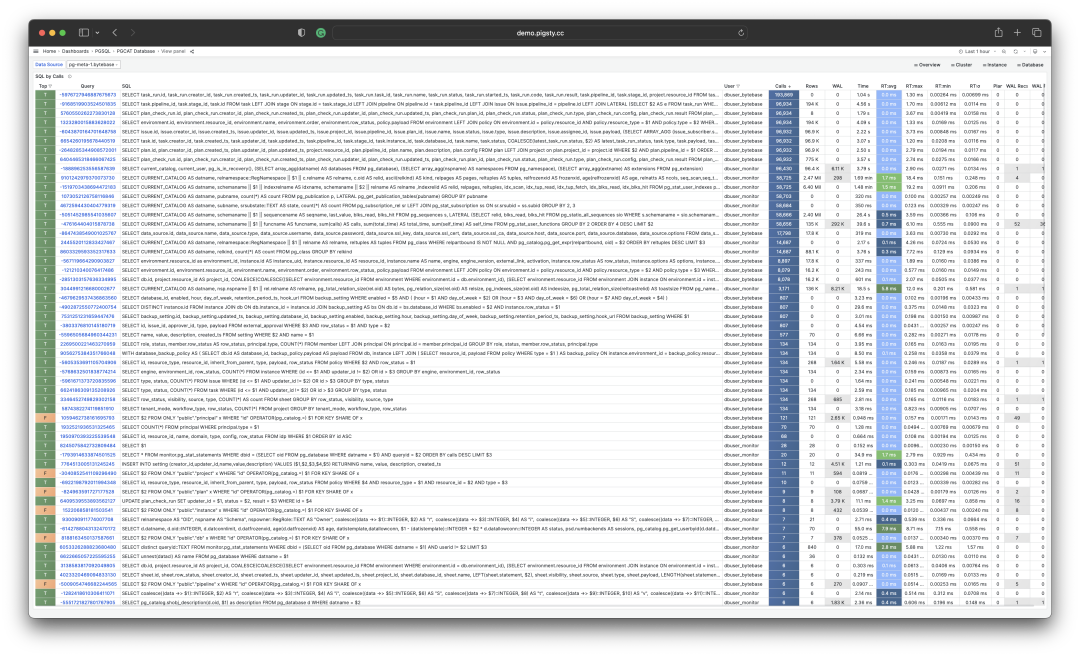
I/O time is helpful for analyzing query spike causes
Summary
Finally, let’s summarize the above content.
PGSS provides rich metrics, among which the most important cumulative metrics can be processed in three ways:
dM/dt: The time derivative of metric M, revealing resource usage per second, typically used for the objective of reducing resource consumption.
dM/dc: The call derivative of metric M, revealing resource usage per call, typically used for the objective of improving user experience.
%M: Percentage metrics showing a query group’s proportion in the entire workload, typically used for the objective of balancing workload.
Typically, we select high-value candidate queries for optimization based on %M: percentage metrics Top queries, and use dM/dt and dM/dc metrics for further evaluation, confirming if there’s optimization space and feasibility, and evaluating optimization effects. Repeat this process continuously.
After understanding the methodology of macro optimization, we can use this approach to locate and optimize slow queries. Here’s a concrete example of Using Monitoring System to Diagnose PG Slow Queries. In the next article, we’ll introduce experience and techniques for PostgreSQL query micro optimization.
References
[1] PostgreSQL HowTO: pg_stat_statements by Nikolay Samokhvalov
[3] Using Monitoring System to Diagnose PG Slow Queries
[4] How to Monitor Existing PostgreSQL (RDS/PolarDB/On-prem) with Pigsty?
[5] Pigsty v2.5 Released: Ubuntu/Debian Support & Monitoring Revamp/New Extensions
Rescue Data with pg_filedump?

Backups are a DBA’s lifeline — but what if your PostgreSQL database has crashed without any backups? Maybe pg_filedump can help!
Recently, I encountered a rather challenging case. Here’s the situation: A user’s PostgreSQL database was corrupted. It was a Gitlab-managed PostgreSQL instance with no replicas, no backups, and no dumps. It was running on BCACHE (using SSD as transparent cache), and after a power outage, it wouldn’t start.
But that wasn’t the end of it. After several rounds of mishandling, it was completely wrecked: First, someone forgot to mount the BCACHE disk, causing Gitlab to reinitialize a new database cluster; then, due to various reasons, isolation failed, and two database processes ran on the same cluster directory, frying the data directory; next, someone ran pg_resetwal without parameters, pushing the database back to its origin point; finally, they let the empty database run for a while and then removed the temporary backup made before the corruption.
When I saw this case, I was speechless: How do you recover from this mess? It seemed like the only option was to extract data directly from the binary files. I suggested they try a data recovery company, and I asked around, but among the many data recovery companies, almost none offered PostgreSQL data recovery services. Those that did only handled basic issues, and for this situation, they all said it was a long shot.
Data recovery quotes are typically based on the number of files, ranging from ¥1000 to ¥5000 per file. With thousands of files in the Gitlab database, roughly 1000 tables, the total recovery cost could easily reach hundreds of thousands. But after a day, no one took the job, which made me think: If no one can handle this, doesn’t that make the PG community look bad?
I thought about it and decided: This job looks painful but also quite challenging and interesting. Let’s treat it as a dead horse and try to revive it — no cure, no pay. You never know until you try, right? So I took it on myself.
The Tool
To do a good job, one must first sharpen one’s tools. For data recovery, the first step is to find the right tool: pg_filedump is a great weapon. It can extract raw binary data from PostgreSQL data pages, handling many low-level tasks.
The tool can be compiled and installed with the classic make three-step process, but you need to have the corresponding major version of PostgreSQL installed first. Gitlab defaults to using PG 13, so ensure the corresponding version’s pg_config is in your path before compiling:
git clone https://github.com/df7cb/pg_filedump
cd pg_filedump && make && sudo make install
Using pg_filedump isn’t complicated. You feed it a data file and tell it the type of each column in the table, and it’ll interpret the data for you. For example, the first step is to find out which databases exist in the cluster. This information is stored in the system view pg_database. This is a system-level table located in the global directory, assigned a fixed OID 1262 during cluster initialization, so the corresponding physical file is typically: global/1262.
vonng=# select 'pg_database'::RegClass::OID;
 oid
------
 1262
This system view has many fields, but we mainly care about the first two: oid and datname. datname is the database name, and oid can be used to locate the database directory. We can use pg_filedump to extract this table and examine it. The -D parameter tells pg_filedump how to interpret the binary data for each row in the table. You can specify the type of each field, separated by commas, and use ~ to ignore the rest.

As you can see, each row of data starts with COPY. Here we found our target database gitlabhq_production with OID 16386. Therefore, all files for this database should be located in the base/16386 subdirectory.
Recovering the Data Dictionary
Knowing the directory of files to recover, the next step is to extract the data dictionary. There are four important tables to focus on:
•pg_class: Contains important metadata for all tables
•pg_namespace: Contains schema metadata
•pg_attribute: Contains all column definitions
•pg_type: Contains type names
Among these, pg_class is the most crucial and indispensable table. The other system views are nice to have: they make our work easier. So, we first attempt to recover this table.
pg_class is a database-level system view with a default OID = 1259, so the corresponding file for pg_class should be: base/16386/1259, in the gitlabhq_production database directory.

A side note: Those familiar with PostgreSQL internals know that while the actual underlying storage filename (RelFileNode) defaults to matching the table’s OID, some operations might change this. In such cases, you can use pg_filedump -m pg_filenode.map to parse the mapping file in the database directory and find the Filenode corresponding to OID 1259. Of course, here they match, so we’ll move on.
We parse its binary file based on the pg_class table structure definition (note: use the table structure for the corresponding PG major version):
pg_filedump -D 'oid,name,oid,oid,oid,oid,oid,oid,oid,int,real,int,oid,bool,bool,char,char,smallint,smallint,bool,bool,bool,bool,bool,bool,char,bool,oid,xid,xid,text,text,text' -i base/16386/1259
Then you can see the parsed data. The data here is single-line records separated by \t, in the same format as PostgreSQL COPY command’s default output. So you can use scripts to grep and filter, remove the COPY at the beginning of each line, and re-import it into a real database table for detailed examination.

When recovering data, there are many details to pay attention to, and the first one is: You need to handle deleted rows. How to identify them? Use the -i parameter to print each row’s metadata. The metadata includes an XMAX field. If a row was deleted by a transaction, this record’s XMAX will be set to that transaction’s XID. So if a row’s XMAX isn’t zero, it means this is a deleted record and shouldn’t be included in the final output.

Here XMAX indicates this is a deleted record
With the pg_class data dictionary, you can clearly find the OID correspondences for other tables, including system views. You can recover pg_namespace, pg_attribute, and pg_type using the same method. What can you do with these four tables?

You can use SQL to generate the input path for each table, automatically construct the type of each column as the -D parameter, and generate the schema for temporary result tables. In short, you can automate all the necessary tasks programmatically.
SELECT  id, name, nspname, relname, nspid, attrs, fields, has_tough_type,
        CASE WHEN toast_page > 0 THEN toast_name ELSE NULL END AS toast_name, relpages, reltuples, path
FROM
    (
        SELECT n.nspname || '.' || c.relname AS "name", n.nspname, c.relname, c.relnamespace AS nspid, c.oid AS id, c.reltoastrelid AS tid,
               toast.relname AS toast_name, toast.relpages AS toast_page,
               c.relpages, c.reltuples, 'data/base/16386/' || c.relfilenode::TEXT AS path
        FROM meta.pg_class c
                 LEFT JOIN meta.pg_namespace n ON c.relnamespace = n.oid
           , LATERAL (SELECT * FROM meta.pg_class t WHERE t.oid = c.reltoastrelid) toast
        WHERE c.relkind = 'r' AND c.relpages > 0
          AND c.relnamespace IN (2200, 35507, 35508)
        ORDER BY c.relnamespace, c.relpages DESC
    ) z,
    LATERAL ( SELECT string_agg(name,',') AS attrs,
                     string_agg(std_type,',') AS fields,
                     max(has_tough_type::INTEGER)::BOOLEAN AS has_tough_type
              FROM meta.pg_columns WHERE relid = z.id ) AS columns;
Note that the data type names supported by pg_filedump -D parameter are strictly limited to standard names, so you must convert boolean to bool, INTEGER to int. If the data type you want to parse isn’t in the list below, you can first try using the TEXT type. For example, the INET type for IP addresses can be parsed using TEXT.
bigint bigserial bool char charN date float float4 float8 int json macaddr name numeric oid real serial smallint smallserial text time timestamp timestamptz timetz uuid varchar varcharN xid xml
But there are indeed other special cases that require additional processing, such as PostgreSQL’s ARRAY type, which we’ll cover in detail later.
Recovering a Regular Table
Recovering a regular data table isn’t fundamentally different from recovering a system catalog table: it’s just that catalog schemas and information are publicly standardized, while the schema of the database to be recovered might not be.
Gitlab is also a well-known open-source software, so finding its database schema definition isn’t difficult. If it’s a regular business system, you can spend more effort to reconstruct the original DDL from pg_catalog.
Once you know the DDL definition, you can use the data type of each column in the DDL to interpret the data in the binary file. Let’s use public.approval_merge_request_rules, a regular table in Gitlab, as an example to demonstrate how to recover such a regular data table.
create table approval_project_rules
(
    id                        bigint,
    created_at                timestamp with time zone,
    updated_at                timestamp with time zone,
    project_id                integer,
    approvals_required        smallint,
    name                      varchar,
    rule_type                 smallint,
    scanners                  text[],
    vulnerabilities_allowed   smallint,
    severity_levels           text[],
    report_type               smallint,
    vulnerability_states      text[],
    orchestration_policy_idx  smallint,
    applies_to_all_protected_branches              boolean,
    security_orchestration_policy_configuration_id bigint,
    scan_result_policy_id                          bigint
);
First, we need to convert these types into types that pg_filedump can recognize. This involves type mapping: if you have uncertain types, like the text[] string array fields above, you can first use text type as a placeholder, or simply use ~ to ignore them:
bigint,timestamptz,timestamptz,int,smallint,varchar,smallint,text,smallint,text,smallint,text,smallint,bool,bigint,bigint
Of course, the first thing to know is that PostgreSQL’s tuple column layout is ordered, and this order is stored in the attrnum field of the system view pg_attribute. The type ID for each column in the table is stored in the atttypid field, and to get the English name of the type, you need to reference the pg_type system view through the type ID (of course, system default types have fixed IDs, so you can also use ID mapping directly). In summary, to get the interpretation method for physical records in a table, you need at least the four system dictionary tables mentioned above.
With the order and types of columns in this table, and knowing the location of this table’s binary file, you can use this information to translate the binary data.
pg_filedump -i -f -D 'bigint,...,bigint' 38304

For output, it’s recommended to add the -i and -f options. The former prints metadata for each row (needed to determine if a row has been deleted based on XMAX); the latter prints the original binary data context (necessary for handling complex data that pg_filedump can’t handle).
Normally, each record will start with either COPY: or Error:. The former represents successful extraction, while the latter represents partial success or failure. If it fails, there can be various reasons that need to be handled separately. For successful data, you can take it directly - each line is a piece of data, separated by \t, replace \N with NULL, process it, and save it in a temporary table for later use.
Of course, the devil is in the details. If data recovery were this easy, it wouldn’t be so challenging.
The Devil is in the Details
When handling data recovery, there are many small details to pay attention to. Here are a few important points.
First is TOAST field handling. TOAST stands for “The Oversized-Attribute Storage Technique”. If you find that a parsed field’s content is (TOASTED), it means this field was too long and was sliced and transferred to a dedicated table - the TOAST table.
If a table has fields that might be TOASTed, it will have a corresponding TOAST table, identified by reltoastrelid in pg_class. TOAST can be treated as a regular table, so you can use the same method to parse TOAST data, stitch it back together, and fill it into the original table. We won’t expand on this here.

The second issue is complex types. As mentioned in the previous section, pg_filedump’s README lists supported types, but types like arrays require additional binary parsing.
For example, when you dump array binary data, you might see a string of \0\0. This is because pg_filedump directly spits out complex types it can’t handle. This brings additional problems - null values in strings will cause your inserts to fail, so your parsing script needs to handle this. When encountering a complex column that can’t be parsed, you should first mark it and keep the binary value for later processing.
Let’s look at a concrete example: using the public.approval_merge_request_rules table from above. From the dumped data, binary view, and ASCII view, we can see some scattered strings: critical, unknown, etc., mixed in with a string of \0 and binary control characters. Yes, this is the binary representation of a string array. PostgreSQL arrays allow arbitrary type nesting at arbitrary depths, so the data structure here is a bit complex.

For example, the highlighted area in the image corresponds to data that is an array containing three strings: {unknown,high,critical}::TEXT[]. 01 represents that this is a one-dimensional array, followed by the null bitmap, and the type OID 0x00000019 representing array elements. 0x19 in decimal is 25, corresponding to the text type in pg_type, indicating this is a string array (if it were 0x17, it would be an integer array). Next is the dimension 0x03 for the first dimension of this array, since this array only has one dimension with three elements; the following 1 tells us where the starting offset of the first dimension is. After that are the three string structures: each starts with a 4-byte length (needs to be right-shifted to handle the marker), followed by the string content, with layout alignment and padding to consider.
In summary, you need to dig through the source code implementation, and there are endless details here: variable length, null bitmaps, field compression, out-of-line storage, and endianness. Make one wrong move, and what you extract is just a useless mess.
You can choose to directly parse the original binary from the recorded context using Python scripts, or register new types and callback handler functions in the pg_filedump source code to reuse PG’s provided C parsing functions. Neither approach is particularly easy.
Fortunately, PostgreSQL itself provides some C language helper functions & macros to help you complete most of the work, and luckily, the arrays in Gitlab are all one-dimensional, with types limited to integer arrays and string arrays. Other data pages with complex types can also be reconstructed from other tables, so the overall workload is still manageable.

Epilogue
This job took me two days to complete. I won’t go into the dirty details of the process - I doubt readers would be interested. After a series of processing, correction, and verification, the data recovery work was finally completed! Except for a few corrupted records in a few tables, all other data was successfully extracted. Wow, a full thousand tables!
I’ve done some data recovery work before, and most cases were relatively simple: data block corruption, control file/CLOG damage, or ransomware infection (writing a few garbage files to the Tablespace). But this is the first time I’ve encountered a case that was so thoroughly wrecked. The reason I dared to take this job was that I have some understanding of the PG kernel and know these tedious implementation details. As long as you know it’s an engineering problem that can be solved, you won’t worry about not being able to complete it, no matter how dirty or tiring the process is.
Despite some shortcomings, pg_filedump is still a good tool. I might consider improving it later to provide complete support for various data types, so we don’t have to write a bunch of Python scripts to handle various tedious details. After completing this case, I’ve already packaged pg_filedump for PG 12-16 x EL 7-9 and placed it in Pigsty’s Yum repository, included by default in Pigsty’s offline software package. It’s now implemented in Pigsty v2.4.1. I sincerely hope you never need to use this extension, but if you ever find yourself in a situation where you do, I hope it’s right there at your fingertips, ready to use out of the box.
Finally, I want to say one thing: Many software applications need databases, but database installation, deployment, and maintenance are high-threshold tasks. The PostgreSQL instance that Gitlab spins up is already quite good quality, but it’s still helpless in this situation, let alone those crude single-instance Docker images made by hand. One major failure can wipe out a company’s accumulated code, data, CI/CD processes, and Issue/PR/MR records. I really suggest you carefully review your database system and at least make regular backups!

The core difference between Gitlab’s Enterprise and Community editions lies in whether the underlying PG has high availability and monitoring. And Pigsty - the out-of-the-box PostgreSQL distribution can better solve these problems for you, completely open source and free, charging nothing: whether it’s high availability, PITR, or monitoring systems, everything is included. Next time you encounter such a problem, you can automatically switch/roll back with one click, handling it much more gracefully. We previously ran our own Gitlab, Jira, Confluence, and other software on it. If you have similar needs, why not give it a try?
Collation in PostgreSQL
Why does Pigsty default to locale=C and encoding=UTF8 when initializing PostgreSQL databases?
The answer is simple: Unless you explicitly need LOCALE-specific features, you should never configure anything other than C.UTF8 for character encoding and collation settings.
I’ve previously written about character encoding, so let’s focus on LOCALE configuration today.
While there might be some justification for using non-UTF8 character encoding on the server side, using any LOCALE other than C is unforgivable. In PostgreSQL, LOCALE isn’t just about trivial things like date and currency display formats - it affects critical functionality.
Incorrect LOCALE configuration can lead to performance degradation of several to dozens of times, and prevents LIKE queries from using regular indexes. Meanwhile, setting LOCALE=C doesn’t affect scenarios that genuinely need localization rules. As the official documentation states: “Use LOCALE only if you really need it.”
Unfortunately, PostgreSQL’s default locale and encoding settings depend on the operating system configuration, so C.UTF8 might not be the default. This leads many users to unknowingly misuse LOCALE, suffering significant performance penalties and missing out on certain database features.

TL;DR
- Always use
UTF8character encoding andCcollation rules. - Using non-C collation rules can increase string comparison operation overhead by several to dozens of times, significantly impacting performance.
- Using non-C collation rules prevents
LIKEqueries from using regular indexes, creating potential pitfalls. - For instances using non-C collation rules, you can create indexes using
text_ops COLLATE "C"ortext_pattern_opsto supportLIKEqueries.
What is LOCALE?
We often see LOCALE (locale) settings in operating systems and various software, but what exactly is it?
LOCALE support refers to applications adhering to cultural preferences, including alphabets, sorting, number formats, etc. A LOCALE consists of many rules and definitions:
LC_COLLATE |
String sorting order |
|---|---|
LC_CTYPE |
Character classification (What is a character? Is its uppercase form equivalent?) |
LC_MESSAGES |
Language of messages |
LC_MONETARY |
Currency format |
LC_NUMERIC |
Number format |
LC_TIME |
Date and time format |
| …… | Others…… |
A LOCALE is a set of rules, typically named using a language code + country code. For example, the LOCALE zh_CN used in mainland China has two parts: zh is the language code, and CN is the country code. In the real world, one language might be used in multiple countries, and one country might have multiple languages. Taking Chinese and China as an example:
China (COUNTRY=CN) related language LOCALEs:
zh: Chinese:zh_CNbo: Tibetan:bo_CNug: Uyghur:ug_CN
Chinese-speaking (LANG=zh) countries or regions:
CNChina:zh_CNHKHong Kong:zh_HKMOMacau:zh_MOTWTaiwan:zh_TWSGSingapore:zh_SG
A LOCALE Example
Let’s look at a typical Locale definition file: Glibc’s zh_CN
Here’s a small excerpt that shows various format definitions - how months and weeks are named, how currency and decimal points are displayed, etc.
But there’s one crucial element here: LC_COLLATE, the sorting method (Collation), which significantly impacts database behavior.
LC_CTYPE
copy "i18n"
translit_start
include  "translit_combining";""
translit_end
class	"hanzi"; /
<U4E00>..<U9FA5>;/
<UF92C>;<UF979>;<UF995>;<UF9E7>;<UF9F1>;<UFA0C>;<UFA0D>;<UFA0E>;/
<UFA0F>;<UFA11>;<UFA13>;<UFA14>;<UFA18>;<UFA1F>;<UFA20>;<UFA21>;/
<UFA23>;<UFA24>;<UFA27>;<UFA28>;<UFA29>
END LC_CTYPE

LC_COLLATE
copy "iso14651_t1_pinyin"
END LC_COLLATE

LC_TIME
% January, February, March, April, May, June, July, August, September, October, November, December
mon           "<U4E00><U6708>";/
     "<U4E8C><U6708>";/
     "<U4E09><U6708>";/
     "<U56DB><U6708>";/
...
% Sunday, Monday, Tuesday, Wednesday, Thursday, Friday, Saturday
day           "<U661F><U671F><U65E5>";/
     "<U661F><U671F><U4E00>";/
     "<U661F><U671F><U4E8C>";/
...
week          7;19971130;1
first_weekday 2
% %Y年%m月%d日 %A %H时%M分%S秒
d_t_fmt       "%Y<U5E74>%m<U6708>%d<U65E5> %A %H<U65F6>%M<U5206>%S<U79D2>"
% %Y年%m月%d日
d_fmt         "%Y<U5E74>%m<U6708>%d<U65E5>"
% %H时%M分%S秒
t_fmt         "%H<U65F6>%M<U5206>%S<U79D2>"
% AM, PM
am_pm         "<U4E0A><U5348>";"<U4E0B><U5348>"
% %p %I时%M分%S秒
t_fmt_ampm    "%p %I<U65F6>%M<U5206>%S<U79D2>"
% %Y年 %m月 %d日 %A %H:%M:%S %Z
date_fmt      "%Y<U5E74> %m<U6708> %d<U65E5> %A %H:%M:%S %Z"
END LC_TIME

LC_NUMERIC
decimal_point "."
thousands_sep ","
grouping      3
END LC_NUMERIC

LC_MONETARY
% ¥
currency_symbol    "<UFFE5>"
int_curr_symbol    "CNY "
For example, zh_CN provides LC_COLLATE using the iso14651_t1_pinyin collation rule, which is a pinyin-based sorting rule.
Let’s demonstrate how LOCALE’s COLLATION affects PostgreSQL behavior with an example.
Collation Example
Create a table containing 7 Chinese characters and perform sorting operations.
CREATE TABLE some_chinese(
    name TEXT PRIMARY KEY
);
INSERT INTO some_chinese VALUES
('阿'),('波'),('磁'),('得'),('饿'),('佛'),('割');

SELECT * FROM some_chinese ORDER BY name;
Execute the following SQL to sort the records using the default C collation rule. Here, we can see that it’s actually sorting based on the ascii|unicode code points.
vonng=# SELECT name, ascii(name) FROM some_chinese ORDER BY name COLLATE "C";
 name | ascii
------+-------
 佛   | 20315
 割   | 21106
 得   | 24471
 波   | 27874
 磁   | 30913
 阿   | 38463
 饿   | 39295
But this code-point-based sorting might be meaningless for Chinese users. For example, a Chinese dictionary wouldn’t use this sorting method. Instead, it would use the pinyin sorting rule used by zh_CN, sorting by pinyin. Like this:
SELECT * FROM some_chinese ORDER BY name COLLATE "zh_CN";
 name
------
 阿
 波
 磁
 得
 饿
 佛
 割
We can see that sorting with the zh_CN collation rule produces results in pinyin order abcdefg, rather than the meaningless Unicode code point order.
Of course, this query result depends on the specific definition of the zh_CN collation rule. Such collation rules aren’t defined by the database itself - the database only provides the C collation (or its alias POSIX). COLLATIONs typically come from either the operating system, glibc, or third-party localization libraries (like icu), so different actual definitions might produce different effects.
But at what cost?
The biggest negative impact of using non-C or non-POSIX LOCALE in PostgreSQL is:
Specific collation rules have a huge performance impact on operations involving string comparisons, and they also prevent LIKE queries from using regular indexes.
Additionally, the C LOCALE is guaranteed by the database itself to work on any operating system and platform, while other LOCALEs aren’t, making non-C Locale less portable.
Performance Impact
Let’s consider an example using LOCALE collation rules. We have 1.5 million Apple Store app names and want to sort them according to different regional rules.
-- Create a table of app names, containing both Chinese and English
CREATE TABLE app(
    name TEXT PRIMARY KEY
);
COPY app FROM '/tmp/app.csv';

-- View table statistics
SELECT
    correlation, -- correlation coefficient 0.03542578, basically random distribution
    avg_width,   -- average length 25 bytes
    n_distinct   -- -1, meaning 1,508,076 records with no duplicates
FROM pg_stats WHERE tablename = 'app';

-- Run a series of experiments with different collation rules
SELECT * FROM app;
SELECT * FROM app order by name;
SELECT * FROM app order by name COLLATE "C";
SELECT * FROM app order by name COLLATE "en_US";
SELECT * FROM app order by name COLLATE "zh_CN";
The results are quite shocking - using C and zh_CN can differ by ten times:
| # | Scenario | Time(ms) | Notes |
|---|---|---|---|
| 1 | No sort | 180 | Uses index |
| 2 | order by name |
969 | Uses index |
| 3 | order by name COLLATE "C" |
1430 | Sequential scan, external sort |
| 4 | order by name COLLATE "en_US" |
10463 | Sequential scan, external sort |
| 5 | order by name COLLATE "zh_CN" |
14852 | Sequential scan, external sort |
Here’s the detailed execution plan for experiment 5. Even with sufficient memory configured, it still spills to disk for external sorting. However, all experiments with explicit LOCALE specification showed this behavior, allowing us to compare the performance difference between C and zh_CN.
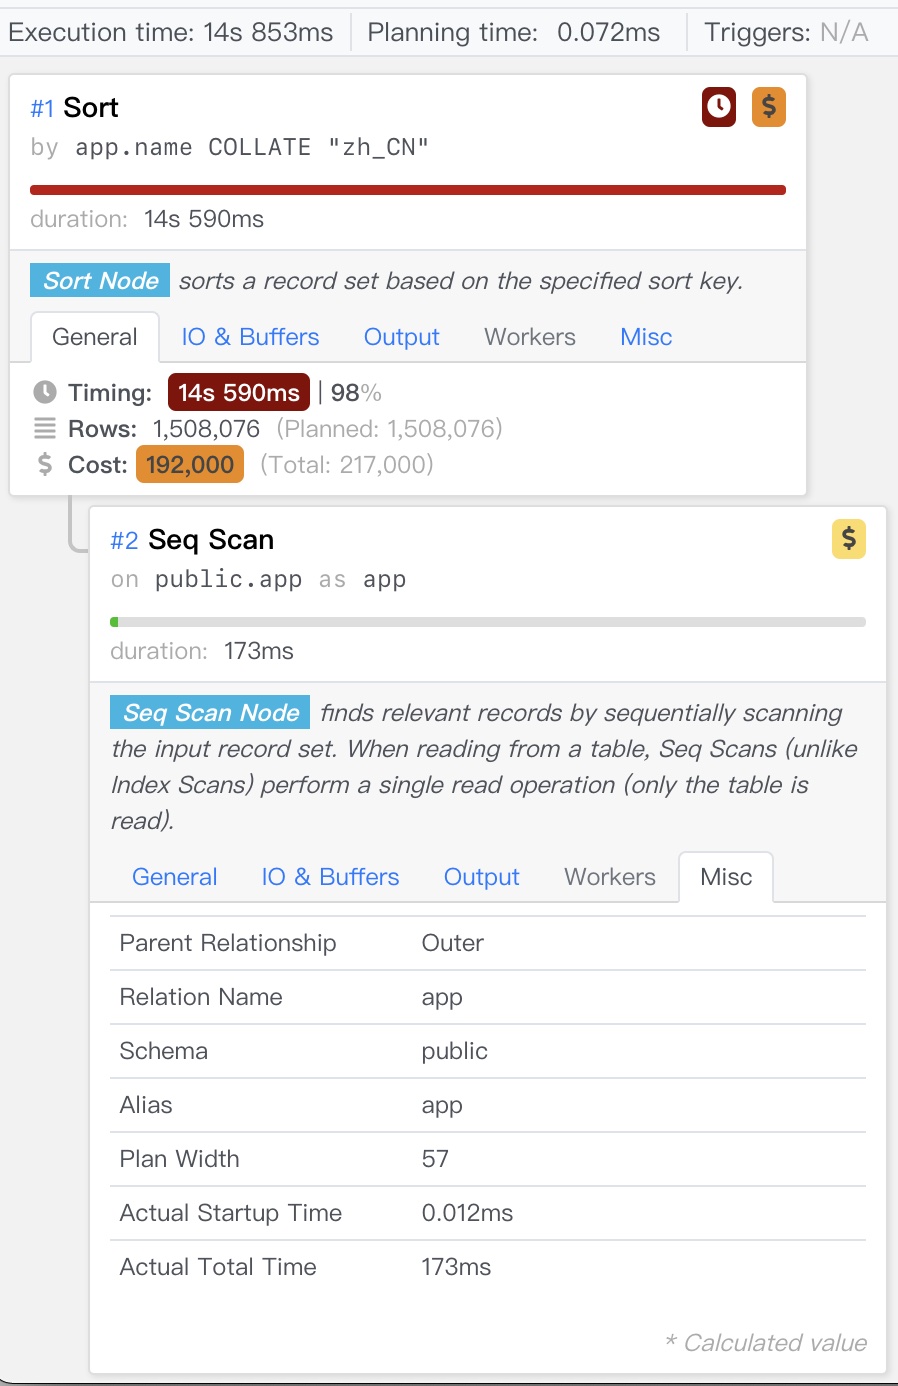
Another more comparative example is comparison operations.
Here, all strings in the table are compared with 'World', equivalent to performing 1.5 million specific rule comparisons on the table, without even involving disk I/O.
SELECT count(*) FROM app WHERE name > 'World';
SELECT count(*) FROM app WHERE name > 'World' COLLATE "C";
SELECT count(*) FROM app WHERE name > 'World' COLLATE "en_US";
SELECT count(*) FROM app WHERE name > 'World' COLLATE "zh_CN";
Even so, compared to C LOCALE, zh_CN still takes nearly 3 times longer.
| # | Scenario | Time(ms) |
|---|---|---|
| 1 | Default | 120 |
| 2 | C | 145 |
| 3 | en_US | 351 |
| 4 | zh_CN | 441 |
If sorting might be O(n²) comparisons with 10x overhead, then the 3x overhead for O(n) comparisons here roughly matches. We can draw a preliminary conclusion:
Compared to C Locale, using zh_CN or other Locales can cause several times additional performance overhead.
Besides performance issues, incorrect Locale can also lead to functional limitations.
Functional Limitations
Besides poor performance, another unacceptable issue is that using non-C LOCALE prevents LIKE queries from using regular indexes.
Let’s use our previous experiment as an example. We’ll execute the following query on database instances using C and en_US as default LOCALE:
SELECT * FROM app WHERE name LIKE '中国%';
Find all apps starting with “中国” (China).
On a C-based database
This query can normally use the app_pkey index, leveraging the ordered nature of the primary key B-tree to speed up the query, completing in about 2 milliseconds.
postgres@meta:5432/meta=# show lc_collate;
 C

postgres@meta:5432/meta=# EXPLAIN SELECT * FROM app WHERE name LIKE '中国%';
                                 QUERY PLAN
-----------------------------------------------------------------------------
 Index Only Scan using app_pkey on app  (cost=0.43..2.65 rows=1510 width=25)
   Index Cond: ((name >= '中国'::text) AND (name < '中图'::text))
   Filter: (name ~~ '中国%'::text)
(3 rows)
On an en_US-based database
We find that this query cannot use the index, performing a full table scan. The query degrades to 70 milliseconds, 30-40 times worse performance.
vonng=# show lc_collate;
 en_US.UTF-8

vonng=# EXPLAIN SELECT * FROM app WHERE name LIKE '中国%';
                        QUERY PLAN
----------------------------------------------------------
 Seq Scan on app  (cost=0.00..29454.95 rows=151 width=25)
   Filter: (name ~~ '中国%'::text)
Why?
Because index (B-tree index) construction is also based on ordering, which means equality and comparison operations.
However, LOCALE has its own set of rules for string equivalence. For example, the Unicode standard defines many counterintuitive equivalence rules (after all, it’s a universal language standard - like multiple characters combining to form a string equivalent to another single character, details in the Modern Character Encoding article).
Therefore, only the simplest C LOCALE can perform pattern matching normally. The C LOCALE’s comparison rules are very simple - just compare character code points one by one, without any fancy tricks. So, if your database unfortunately uses a non-C LOCALE, then LIKE queries cannot use default indexes.
Solution
For non-C LOCALE instances, only special types of indexes can support such queries:
CREATE INDEX ON app(name COLLATE "C");
CREATE INDEX ON app(name text_pattern_ops);
Here, using the text_pattern_ops operator family to create an index can also support LIKE queries. This is a special operator family for pattern matching that ignores LOCALE and directly performs pattern matching based on character-by-character comparison, which is the C LOCALE way.
Therefore, in this case, only indexes built on the text_pattern_ops operator family, or indexes using COLLATE "C"' on the default text_ops, can support LIKE queries.
vonng=# EXPLAIN ANALYZE SELECT * FROM app WHERE name LIKE '中国%';

Index Only Scan using app_name_idx on app  (cost=0.43..1.45 rows=151 width=25) (actual time=0.053..0.731 rows=2360 loops=1)
   Index Cond: ((name ~>=~ '中国'::text) AND (name ~<~ '中图'::text))
   Filter: (name ~~ '中国%'::text COLLATE "en_US.UTF-8")
After creating the index, we can see that the original LIKE query can use the index.
The issue of LIKE not being able to use regular indexes might seem solvable by creating an additional text_pattern_ops index. But this means that what could have been solved directly using the existing PRIMARY KEY or UNIQUE constraint’s built-in index now requires additional maintenance costs and storage space.
For developers unfamiliar with this issue, they might encounter performance issues in production because queries aren’t using indexes (e.g., if development uses C but production uses non-C LOCALE).
Compatibility
Suppose you’ve inherited a database already using non-C LOCALE (this is quite common), and now that you know the dangers of using non-C LOCALE, you decide to change it back.
What should you watch out for? Specifically, Locale configuration affects the following PostgreSQL features:
- Queries using
LIKEclauses. - Any queries relying on specific LOCALE collation rules, e.g., using pinyin sorting as result ordering.
- Queries using case conversion related functions:
upper,lower, andinitcap. - The
to_charfunction family, when formatting to local time. - Case-insensitive matching in regular expressions (
SIMILAR TO,~).
So, for any queries involving case conversion, always “explicitly specify Collation!”
If unsure, you can list all queries involving the following keywords using pg_stat_statements for manual review:
LIKE|ILIKE                   -- Using pattern matching?
SIMILAR TO | ~ | regexp_xxx  -- Using i option?
upper, lower, initcap        -- Using for languages with case (Western characters)?
ORDER BY col                 -- When sorting by text columns, relying on specific collation? (e.g., pinyin)
Compatibility Modifications
Generally, C LOCALE is a superset of other LOCALE configurations in terms of functionality, and you can always switch from other LOCALEs to C. If your business doesn’t use these features, you usually don’t need to do anything. If you use localization features, you can always achieve the same effect in C LOCALE by explicitly specifying COLLATE.
SELECT upper('a' COLLATE "zh_CN");  -- Perform case conversion based on zh_CN rules
SELECT  '阿' < '波';                 -- false, under default collation 阿(38463) > 波(27874)
SELECT  '阿' < '波' COLLATE "zh_CN"; -- true, explicitly using Chinese pinyin collation: 阿(a) < 波(bo)
However, please note that collations provided by glibc - like “zh_CN” - aren’t necessarily stable. The PostgreSQL community’s recommended best practice is to use C or POSIX as the default collation.
Then use ICU as the collation provider, for example:
SELECT '阿' < '波' COLLATE "zh-x-icu"; -- true, explicitly using Chinese pinyin collation: 阿(a) < 波(bo)
- zh-x-icu: Roughly represents “Generic Chinese (unspecified simplified/traditional)”, using ICU rules.
- zh-Hans-x-icu: Represents Simplified Chinese (Hans = Han Simplified), ICU rules.
- zh-Hans-CN-x-icu: Simplified Chinese (Mainland China)
- zh-Hans-HK-x-icu: Simplified Chinese (Hong Kong)
- zh-Hant-x-icu: Represents Traditional Chinese (Hant = Han Traditional)
Overriding CTYPE
You can override CTYPE when performing case conversions:
SELECT
    'é'          AS original,
    UPPER('é')   AS upper_default,  -- Using default Locale
    UPPER('é' COLLATE "C") AS upper_en_c, -- C Locale doesn't handle these characters 'é'
    UPPER('é' COLLATE PG_C_UTF8) AS upper_en_cutf8, -- C.UTF8 handles some case issues É
    UPPER('é' COLLATE "en_US.UTF-8") AS upper_en_us; -- en_US.UTF8 converts to uppercase É
  oid  |     collname     | collnamespace | collowner | collprovider | collisdeterministic | collencoding | collcollate  |  collctype   | colllocale | collicurules | collversion
-------+------------------+---------------+-----------+--------------+---------------------+--------------+--------------+--------------+------------+--------------+-------------
 12888 | lzh_TW           |            11 |        10 | c            | t                   |            6 | lzh_TW       | lzh_TW       | NULL       | NULL         | 2.28
 12889 | lzh_TW.utf8      |            11 |        10 | c            | t                   |            6 | lzh_TW.utf8  | lzh_TW.utf8  | NULL       | NULL         | 2.28
 13187 | zh_CN            |            11 |        10 | c            | t                   |            2 | zh_CN        | zh_CN        | NULL       | NULL         | 2.28
 13188 | zh_CN.gb2312     |            11 |        10 | c            | t                   |            2 | zh_CN.gb2312 | zh_CN.gb2312 | NULL       | NULL         | 2.28
 13189 | zh_CN.utf8       |            11 |        10 | c            | t                   |            6 | zh_CN.utf8   | zh_CN.utf8   | NULL       | NULL         | 2.28
 13190 | zh_HK.utf8       |            11 |        10 | c            | t                   |            6 | zh_HK.utf8   | zh_HK.utf8   | NULL       | NULL         | 2.28
 13191 | zh_SG            |            11 |        10 | c            | t                   |            2 | zh_SG        | zh_SG        | NULL       | NULL         | 2.28
 13192 | zh_SG.gb2312     |            11 |        10 | c            | t                   |            2 | zh_SG.gb2312 | zh_SG.gb2312 | NULL       | NULL         | 2.28
 13193 | zh_SG.utf8       |            11 |        10 | c            | t                   |            6 | zh_SG.utf8   | zh_SG.utf8   | NULL       | NULL         | 2.28
 13194 | zh_TW.euctw      |            11 |        10 | c            | t                   |            4 | zh_TW.euctw  | zh_TW.euctw  | NULL       | NULL         | 2.28
 13195 | zh_TW.utf8       |            11 |        10 | c            | t                   |            6 | zh_TW.utf8   | zh_TW.utf8   | NULL       | NULL         | 2.28
 13349 | zh_CN            |            11 |        10 | c            | t                   |            6 | zh_CN.utf8   | zh_CN.utf8   | NULL       | NULL         | 2.28
 13350 | zh_HK            |            11 |        10 | c            | t                   |            6 | zh_HK.utf8   | zh_HK.utf8   | NULL       | NULL         | 2.28
 13351 | zh_SG            |            11 |        10 | c            | t                   |            6 | zh_SG.utf8   | zh_SG.utf8   | NULL       | NULL         | 2.28
 13352 | zh_TW            |            11 |        10 | c            | t                   |            4 | zh_TW.euctw  | zh_TW.euctw  | NULL       | NULL         | 2.28
 13353 | zh_TW            |            11 |        10 | c            | t                   |            6 | zh_TW.utf8   | zh_TW.utf8   | NULL       | NULL         | 2.28
 14066 | zh-x-icu         |            11 |        10 | i            | t                   |           -1 | NULL         | NULL         | zh         | NULL         | 153.80.32.1
 14067 | zh-Hans-x-icu    |            11 |        10 | i            | t                   |           -1 | NULL         | NULL         | zh-Hans    | NULL         | 153.80.32.1
 14068 | zh-Hans-CN-x-icu |            11 |        10 | i            | t                   |           -1 | NULL         | NULL         | zh-Hans-CN | NULL         | 153.80.32.1
 14069 | zh-Hans-HK-x-icu |            11 |        10 | i            | t                   |           -1 | NULL         | NULL         | zh-Hans-HK | NULL         | 153.80.32.1
 14070 | zh-Hans-MO-x-icu |            11 |        10 | i            | t                   |           -1 | NULL         | NULL         | zh-Hans-MO | NULL         | 153.80.32.1
 14071 | zh-Hans-SG-x-icu |            11 |        10 | i            | t                   |           -1 | NULL         | NULL         | zh-Hans-SG | NULL         | 153.80.32.1
 14072 | zh-Hant-x-icu    |            11 |        10 | i            | t                   |           -1 | NULL         | NULL         | zh-Hant    | NULL         | 153.80.32.1
 14073 | zh-Hant-HK-x-icu |            11 |        10 | i            | t                   |           -1 | NULL         | NULL         | zh-Hant-HK | NULL         | 153.80.32.1
 14074 | zh-Hant-MO-x-icu |            11 |        10 | i            | t                   |           -1 | NULL         | NULL         | zh-Hant-MO | NULL         | 153.80.32.1
 14075 | zh-Hant-TW-x-icu |            11 |        10 | i            | t                   |           -1 | NULL         | NULL         | zh-Hant-TW | NULL         | 153.80.32.1
The only known issue currently appears in the pg_trgm extension.
https://www.pgevents.ca/events/pgconfdev2024/sessions/session/95/slides/26/pgcon24_collation.pdf
PostgreSQL Replica Identity Explained
Introduction: DIY Logical Replication
The concept of Replica Identity serves logical replication.
Logical replication fundamentally works by decoding row-level changes (INSERT/UPDATE/DELETE) on published tables and applying them to subscribers.
The mechanism somewhat resembles row-level triggers, where changes are processed row by row after transaction completion.
Suppose you need to implement logical replication manually using triggers, copying changes from table A to table B. The trigger function would typically look like this:
-- Notification trigger
CREATE OR REPLACE FUNCTION replicate_change() RETURNS TRIGGER AS $$
BEGIN
  IF    (TG_OP = 'INSERT') THEN
  -- INSERT INTO tbl_b VALUES (NEW.col);
  ELSIF (TG_OP = 'DELETE') THEN
	-- DELETE tbl_b WHERE id = OLD.id;
  ELSIF (TG_OP = 'UPDATE') THEN
	-- UPDATE tbl_b SET col = NEW.col,... WHERE id = OLD.id;
  END IF;
END; $$ LANGUAGE plpgsql;
The trigger provides two variables: OLD and NEW, containing the record’s previous and new values respectively.
INSERToperations only have theNEWvariable - we simply insert it into the target table.DELETEoperations only have theOLDvariable - we delete the record by ID from the target table.UPDATEoperations have bothOLDandNEWvariables - we locate the record in table B usingOLD.idand update it withNEWvalues.
This trigger-based “logical replication” achieves our goal. Similarly, in logical replication, when table A has a primary key column id, deleting a record (e.g., id = 1) only requires sending id = 1 to the subscriber, not the entire deleted tuple. Here, the primary key column id serves as the replica identity.
However, this example assumes that tables A and B have identical schemas with a primary key named id.
For a production-grade logical replication solution (PostgreSQL 10.0+), this assumption is unreasonable. The system cannot require users to always have primary keys or to name them id.
Thus, the concept of Replica Identity was introduced. Replica Identity generalizes and abstracts the OLD.id assumption, telling the logical replication system which information can uniquely identify a record.
Replica Identity
For logical replication, INSERT events don’t require special handling, but DELETE|UPDATE operations must provide a way to identify rows - the Replica Identity. A replica identity is a set of columns that can uniquely identify a record. Conceptually, this is similar to a primary key column set, though columns from non-null unique indexes (candidate keys) can serve the same purpose.
A table included in a logical replication publication must have a Replica Identity configured. This allows the subscriber to locate and update the correct rows for UPDATE and DELETE operations. By default, primary keys and non-null unique indexes can serve as replica identities.
Note that Replica Identity is distinct from a table’s primary key or non-null unique indexes. Replica Identity is a table property that specifies which information is used as an identifier in logical replication records for subscriber-side record location and change application.
As described in the PostgreSQL 13 official documentation, there are four configuration modes for table Replica Identity:
- Default mode: The standard mode for non-system tables. Uses primary key columns if available, otherwise falls back to full mode.
- Index mode: Uses columns from a specific qualified index as the identity
- Full mode: Uses all columns in the record as the replica identity (similar to all columns collectively forming a primary key)
- Nothing mode: Records no replica identity, meaning
UPDATE|DELETEoperations cannot be replicated to subscribers.
Querying Replica Identity
A table’s Replica Identity can be checked via pg_class.relreplident.
This is a character-type “enum” indicating which columns are used to assemble the “replica identity”: d = default, f = all columns, i = specific index, n = no replica identity.
To check if a table has usable replica identity index constraints:
SELECT quote_ident(nspname) || '.' || quote_ident(relname) AS name, con.ri AS keys,
       CASE relreplident WHEN 'd' THEN 'default' WHEN 'n' THEN 'nothing' WHEN 'f' THEN 'full' WHEN 'i' THEN 'index' END AS replica_identity
FROM pg_class c JOIN pg_namespace n ON c.relnamespace = n.oid, LATERAL (SELECT array_agg(contype) AS ri FROM pg_constraint WHERE conrelid = c.oid) con
WHERE relkind = 'r' AND nspname NOT IN ('pg_catalog', 'information_schema', 'monitor', 'repack', 'pg_toast')
ORDER BY 2,3;
Configuring Replica Identity
Table replica identity can be modified using ALTER TABLE:
ALTER TABLE tbl REPLICA IDENTITY { DEFAULT | USING INDEX index_name | FULL | NOTHING };
-- Four specific forms
ALTER TABLE t_normal REPLICA IDENTITY DEFAULT;                    -- Use primary key, or FULL if none exists
ALTER TABLE t_normal REPLICA IDENTITY FULL;                       -- Use entire row as identity
ALTER TABLE t_normal REPLICA IDENTITY USING INDEX t_normal_v_key; -- Use unique index
ALTER TABLE t_normal REPLICA IDENTITY NOTHING;                    -- No replica identity
Replica Identity Examples
Let’s demonstrate replica identity effects with a concrete example:
CREATE TABLE test(k text primary key, v int not null unique);
We have a table test with two columns k and v.
INSERT INTO test VALUES('Alice', '1'), ('Bob', '2');
UPDATE test SET v = '3' WHERE k = 'Alice';    -- update Alice value to 3
UPDATE test SET k = 'Oscar' WHERE k = 'Bob';  -- rename Bob to Oscar
DELETE FROM test WHERE k = 'Alice';           -- delete Alice
The corresponding logical decoding results:
table public.test: INSERT: k[text]:'Alice' v[integer]:1
table public.test: INSERT: k[text]:'Bob' v[integer]:2
table public.test: UPDATE: k[text]:'Alice' v[integer]:3
table public.test: UPDATE: old-key: k[text]:'Bob' new-tuple: k[text]:'Oscar' v[integer]:2
table public.test: DELETE: k[text]:'Alice'
By default, PostgreSQL uses the table’s primary key as the replica identity, so UPDATE|DELETE operations locate records using the k column.
We can manually change the replica identity to use the non-null unique column v:
ALTER TABLE test REPLICA IDENTITY USING INDEX test_v_key; -- Replica identity based on UNIQUE index
The same changes now produce these logical decoding results, with v appearing as the identity in all UPDATE|DELETE events:
table public.test: INSERT: k[text]:'Alice' v[integer]:1
table public.test: INSERT: k[text]:'Bob' v[integer]:2
table public.test: UPDATE: old-key: v[integer]:1 new-tuple: k[text]:'Alice' v[integer]:3
table public.test: UPDATE: k[text]:'Oscar' v[integer]:2
table public.test: DELETE: v[integer]:3
Using full identity mode:
ALTER TABLE test REPLICA IDENTITY FULL; -- Table test now uses all columns as replica identity
Here, both k and v serve as identity identifiers in UPDATE|DELETE logs. This is a fallback option for tables without primary keys.
table public.test: INSERT: k[text]:'Alice' v[integer]:1
table public.test: INSERT: k[text]:'Bob' v[integer]:2
table public.test: UPDATE: old-key: k[text]:'Alice' v[integer]:1 new-tuple: k[text]:'Alice' v[integer]:3
table public.test: UPDATE: old-key: k[text]:'Bob' v[integer]:2 new-tuple: k[text]:'Oscar' v[integer]:2
table public.test: DELETE: k[text]:'Alice' v[integer]:3
Using nothing mode:
ALTER TABLE test REPLICA IDENTITY NOTHING; -- Table test now has no replica identity
The logical decoding records show UPDATE operations with only new records (no unique identity from old records), and DELETE operations with no information at all:
table public.test: INSERT: k[text]:'Alice' v[integer]:1
table public.test: INSERT: k[text]:'Bob' v[integer]:2
table public.test: UPDATE: k[text]:'Alice' v[integer]:3
table public.test: UPDATE: k[text]:'Oscar' v[integer]:2
table public.test: DELETE: (no-tuple-data)
Such logical change logs are useless for subscribers. In practice, DELETE|UPDATE operations on tables without replica identity in logical replication will fail immediately.
Replica Identity Details
Table replica identity configuration and table indexes are relatively orthogonal factors.
While various combinations are possible, only three scenarios are practical in real-world usage:
- Table has a primary key, using default
defaultreplica identity - Table has no primary key but has non-null unique indexes, explicitly configured with
indexreplica identity - Table has neither primary key nor non-null unique indexes, explicitly configured with
fullreplica identity (very inefficient, only as a fallback) - All other scenarios cannot properly support logical replication functionality
| Replica Identity Mode\Table Constraints | Primary Key(p) | Non-null Unique Index(u) | Neither(n) |
|---|---|---|---|
| default | valid | x | x |
| index | x | valid | x |
| full | ineff | ineff | ineff |
| nothing | x | x | x |
Let’s examine some edge cases.
Rebuilding Primary Keys
Suppose we want to rebuild a table’s primary key index to reclaim space due to index bloat:
CREATE TABLE test(k text primary key, v int);
CREATE UNIQUE INDEX test_pkey2 ON test(k);
BEGIN;
ALTER TABLE test DROP CONSTRAINT test_pkey;
ALTER TABLE test ADD PRIMARY KEY USING INDEX test_pkey2;
COMMIT;
In default mode, rebuilding and replacing the primary key constraint and index does not affect the replica identity.
Rebuilding Unique Indexes
Suppose we want to rebuild a non-null unique index to reclaim space:
CREATE TABLE test(k text, v int not null unique);
ALTER TABLE test REPLICA IDENTITY USING INDEX test_v_key;
CREATE UNIQUE INDEX test_v_key2 ON test(v);
-- Replace old Unique index with new test_v_key2 index
BEGIN;
ALTER TABLE test ADD UNIQUE USING INDEX test_v_key2;
ALTER TABLE test DROP CONSTRAINT test_v_key;
COMMIT;
Unlike default mode, in index mode, replica identity is bound to the specific index:
                                    Table "public.test"
 Column |  Type   | Collation | Nullable | Default | Storage  | Stats target | Description
--------+---------+-----------+----------+---------+----------+--------------+-------------
 k      | text    |           |          |         | extended |              |
 v      | integer |           | not null |         | plain    |              |
Indexes:
    "test_v_key" UNIQUE CONSTRAINT, btree (v) REPLICA IDENTITY
    "test_v_key2" UNIQUE CONSTRAINT, btree (v)
This means that replacing a UNIQUE index through substitution will cause replica identity loss.
There are two solutions:
- Use
REINDEX INDEX (CONCURRENTLY)to rebuild the index without losing replica identity information. - Refresh the table’s default replica identity when replacing the index:
BEGIN;
ALTER TABLE test ADD UNIQUE USING INDEX test_v_key2;
ALTER TABLE test REPLICA IDENTITY USING INDEX test_v_key2;
ALTER TABLE test DROP CONSTRAINT test_v_key;
COMMIT;
Note: Removing an index used as an identity. Even though the table configuration still shows index mode, the effect is the same as nothing. So don’t casually modify identity indexes.
Using Unqualified Indexes as Replica Identity
A replica identity requires a unique, non-deferrable, table-wide index on non-nullable columns.
The classic examples are primary key indexes and single-column non-null indexes declared via col type NOT NULL UNIQUE.
The NOT NULL requirement exists because NULL values cannot be compared for equality. A table can have multiple records with NULL values in a UNIQUE column, so nullable columns cannot uniquely identify records. Attempting to use a regular UNIQUE index (without non-null constraints) as a replica identity will fail:
[42809] ERROR: index "t_normal_v_key" cannot be used as replica identity because column "v" is nullable
Using FULL Replica Identity
If no replica identity exists, you can set it to FULL, using the entire row as the replica identity.
Using FULL mode replica identity is inefficient, so this configuration should only be used as a fallback or for very small tables. Each row modification requires a full table scan on the subscriber, which can easily overwhelm the subscriber.
FULL Mode Limitations
Using FULL mode replica identity has another limitation: the subscriber’s table replica identity columns must either match the publisher’s or be fewer in number. Otherwise, correctness cannot be guaranteed. Consider this example:
If both publisher and subscriber tables use FULL replica identity, but the subscriber’s table has an extra column (yes, logical replication allows subscriber tables to have columns not present in the publisher), then the subscriber’s table replica identity includes more columns than the publisher’s. If the publisher deletes a record (f1=a, f2=a), this could delete two records on the subscriber that match the identity equality condition.
     (Publication)       ------>           (Subscription)
|--- f1 ---|--- f2 ---|          |--- f1 ---|--- f2 ---|--- f3 ---|
|    a     |     a    |          |    a     |     a    |     b    |
                                 |    a     |     a    |     c    |
How FULL Mode Handles Duplicate Rows
PostgreSQL’s logical replication can “correctly” handle scenarios with identical rows in FULL mode. Consider this poorly designed table with multiple identical records:
CREATE TABLE shitty_table(
	 f1  TEXT,
	 f2  TEXT,
	 f3  TEXT
);
INSERT INTO shitty_table VALUES ('a', 'a', 'a'), ('a', 'a', 'a'), ('a', 'a', 'a');
In FULL mode, the entire row serves as the replica identity. Suppose we cheat using ctid scanning to delete one of the three identical records:
# SELECT ctid,* FROM shitty_table;
 ctid  | a | b | c
-------+---+---+---
 (0,1) | a | a | a
 (0,2) | a | a | a
 (0,3) | a | a | a

# DELETE FROM shitty_table WHERE ctid = '(0,1)';
DELETE 1

# SELECT ctid,* FROM shitty_table;
 ctid  | a | b | c
-------+---+---+---
 (0,2) | a | a | a
 (0,3) | a | a | a
Logically, using the entire row as an identity, the subscriber would execute:
DELETE FROM shitty_table WHERE f1 = 'a' AND f2 = 'a' AND f3 = 'a'
This would appear to delete all three records. However, because PostgreSQL’s change records operate at the row level, this change only affects the first matching record. Thus, the subscriber’s behavior is to delete one of the three rows, maintaining logical equivalence with the publisher.
Slow Query Diagnosis
You can’t optimize what you can’t measure
Slow queries are the arch-enemy of online business databases. Knowing how to diagnose and locate slow queries is an essential skill for DBAs.
This article introduces a general methodology for diagnosing slow queries using Pigsty, a monitoring system.
The Impact of Slow Queries
For PostgreSQL databases serving online business transactions, slow queries can cause several problems:
- Slow queries consume database connections, leaving no connections available for normal queries, leading to query pileup and potential database meltdown.
- Slow queries can lock old tuple versions that have been cleaned up on the primary, causing replication replay processes to stall and leading to replication lag.
- The slower the query, the higher the chance of deadlocks, lock waits, and transaction conflicts.
- Slow queries waste system resources and increase system load.
Therefore, a competent DBA must know how to quickly identify and address slow queries.
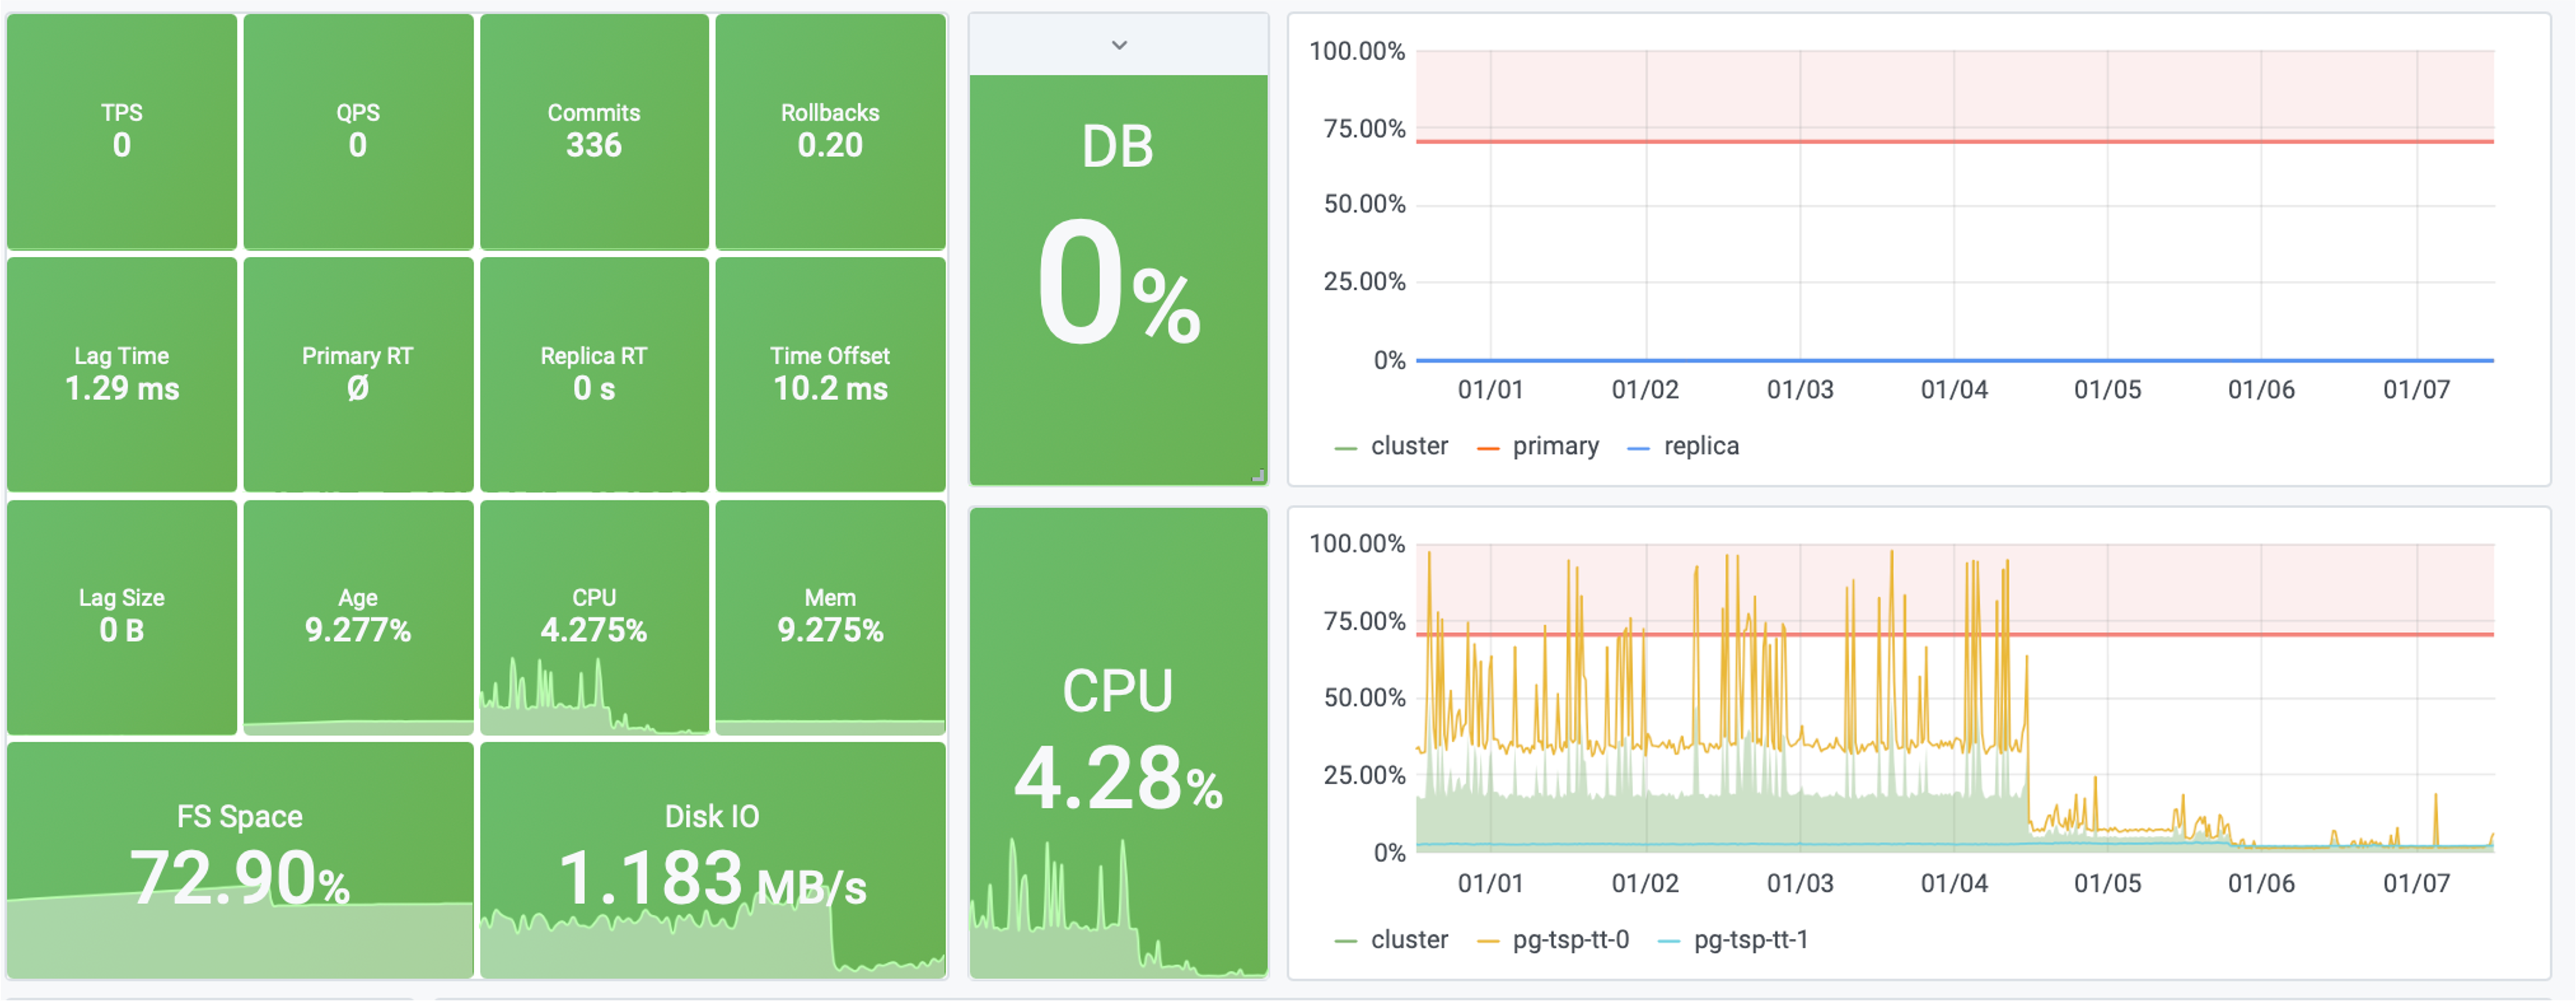
Figure: After optimizing a slow query, system saturation dropped from 40% to 4%
Traditional Methods for Slow Query Diagnosis
Traditionally, there are two ways to obtain information about slow queries in PostgreSQL: the official extension pg_stat_statements and slow query logs.
Slow query logs, as the name suggests, record all queries that take longer than the log_min_duration_statement parameter. They are indispensable for analyzing specific cases and one-off slow queries. However, slow query logs have limitations. In production environments, for performance reasons, we typically only log queries exceeding a certain threshold, which means we miss out on a lot of information. That said, despite the overhead, full query logging remains the ultimate weapon for slow query analysis.
The more commonly used tool for slow query diagnosis is pg_stat_statements. This is an extremely useful extension that collects statistical information about queries running in the database. It’s strongly recommended to enable this extension in all scenarios.
pg_stat_statements provides raw metrics in the form of a system view. Each query type (queries with the same execution plan after variable extraction) is assigned a query ID, followed by metrics like call count, total time, max/min/average execution time, standard deviation of response time, average rows returned per call, and time spent on block I/O.
A simple approach is to look at metrics like mean_time/max_time. From the system catalog, you can indeed see the historical average response time for a query type. For identifying slow queries, this might be sufficient. However, these metrics are just a static snapshot of the system at the current moment, so they can only answer limited questions. For example, if you want to see whether a query’s performance has improved after adding a new index, this approach would be cumbersome.
pg_stat_statements needs to be specified in shared_preload_library and explicitly created in the database using CREATE EXTENSION pg_stat_statements. After creating the extension, you can access query statistics through the pg_stat_statements view.
Defining Slow Queries
How slow is too slow?
This depends on the business and the actual query type - there’s no universal standard.
As a rule of thumb:
- For frequent CRUD point queries, anything over 1ms can be considered slow.
- For occasional one-off queries, typically anything over 100ms or 1s can be considered slow.
Slow Query Diagnosis with Pigsty
A monitoring system can provide more comprehensive answers about slow queries. The data in a monitoring system consists of countless historical snapshots (e.g., sampled every 5 seconds). This allows users to look back at any point in time and examine changes in average query response times across different periods.

The above image shows the interface provided by Pigsty’s PG Query Detail, displaying detailed information about a single query.
This is a typical slow query with an average response time of several seconds. After adding an index, as shown in the Query RT dashboard on the right, the query’s average response time dropped from seconds to milliseconds.
Users can leverage the insights provided by the monitoring system to quickly locate slow queries in the database, identify problems, and formulate hypotheses. More importantly, users can immediately examine detailed metrics at different levels for tables and queries, apply solutions, and get real-time feedback, which is extremely helpful for emergency troubleshooting.
Sometimes, the monitoring system serves not just to provide data and feedback, but also as a calming influence: imagine a slow query causing a production database meltdown. If management or clients don’t have a transparent way to see the current status, they might anxiously push for updates, further affecting problem resolution speed. The monitoring system can also serve as a basis for precise management. You can confidently use monitoring metrics to demonstrate improvements to management and clients.
A Simulated Slow Query Case Study
Talk is cheap, show me the code
Assuming you have a Pigsty Sandbox Demo Environment, we’ll use it to demonstrate the process of locating and handling slow queries.
Simulating Slow Queries
Since we don’t have an actual business system, we’ll simulate slow queries in a simple and quick way using pgbench’s TPC-B-like scenario.
Using make ri / make ro / make rw, initialize pgbench test cases on the pg-test cluster and apply read-write load:
# 50TPS write load
while true; do pgbench -nv -P1 -c20 --rate=50 -T10 postgres://test:test@pg-test:5433/test; done

# 1000TPS read-only load
while true; do pgbench -nv -P1 -c40 --select-only --rate=1000 -T10 postgres://test:test@pg-test:5434/test; done
Now that we have a simulated business system running, let’s simulate a slow query scenario in a straightforward way. On the primary node of the pg-test cluster, execute the following command to drop the primary key from the pgbench_accounts table:
ALTER TABLE pgbench_accounts DROP CONSTRAINT pgbench_accounts_pkey;
This command removes the primary key from the pgbench_accounts table, causing related queries to switch from index scans to sequential full table scans, turning them all into slow queries. Visit PG Instance ➡️ Query ➡️ QPS to see the results:
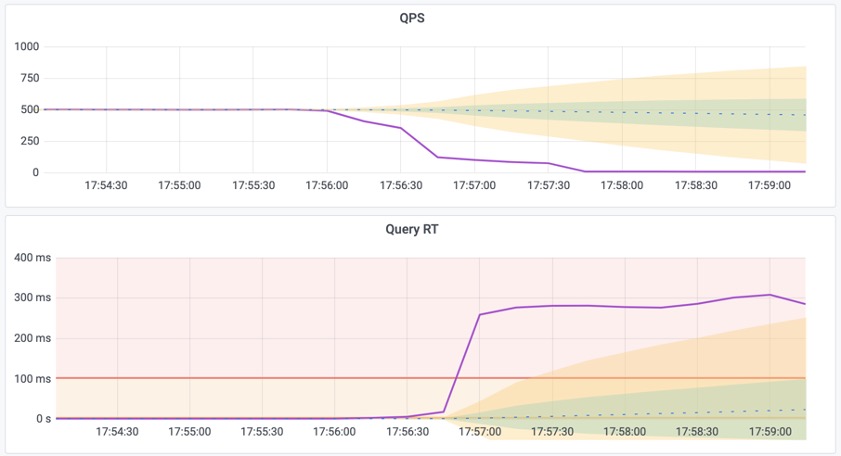
Figure 1: Average query response time spikes from 1ms to 300ms, and QPS on a single replica instance drops from 500 to 7.
Meanwhile, the instance becomes overloaded due to slow query pileup. Visit the PG Cluster homepage to see the cluster load spike:
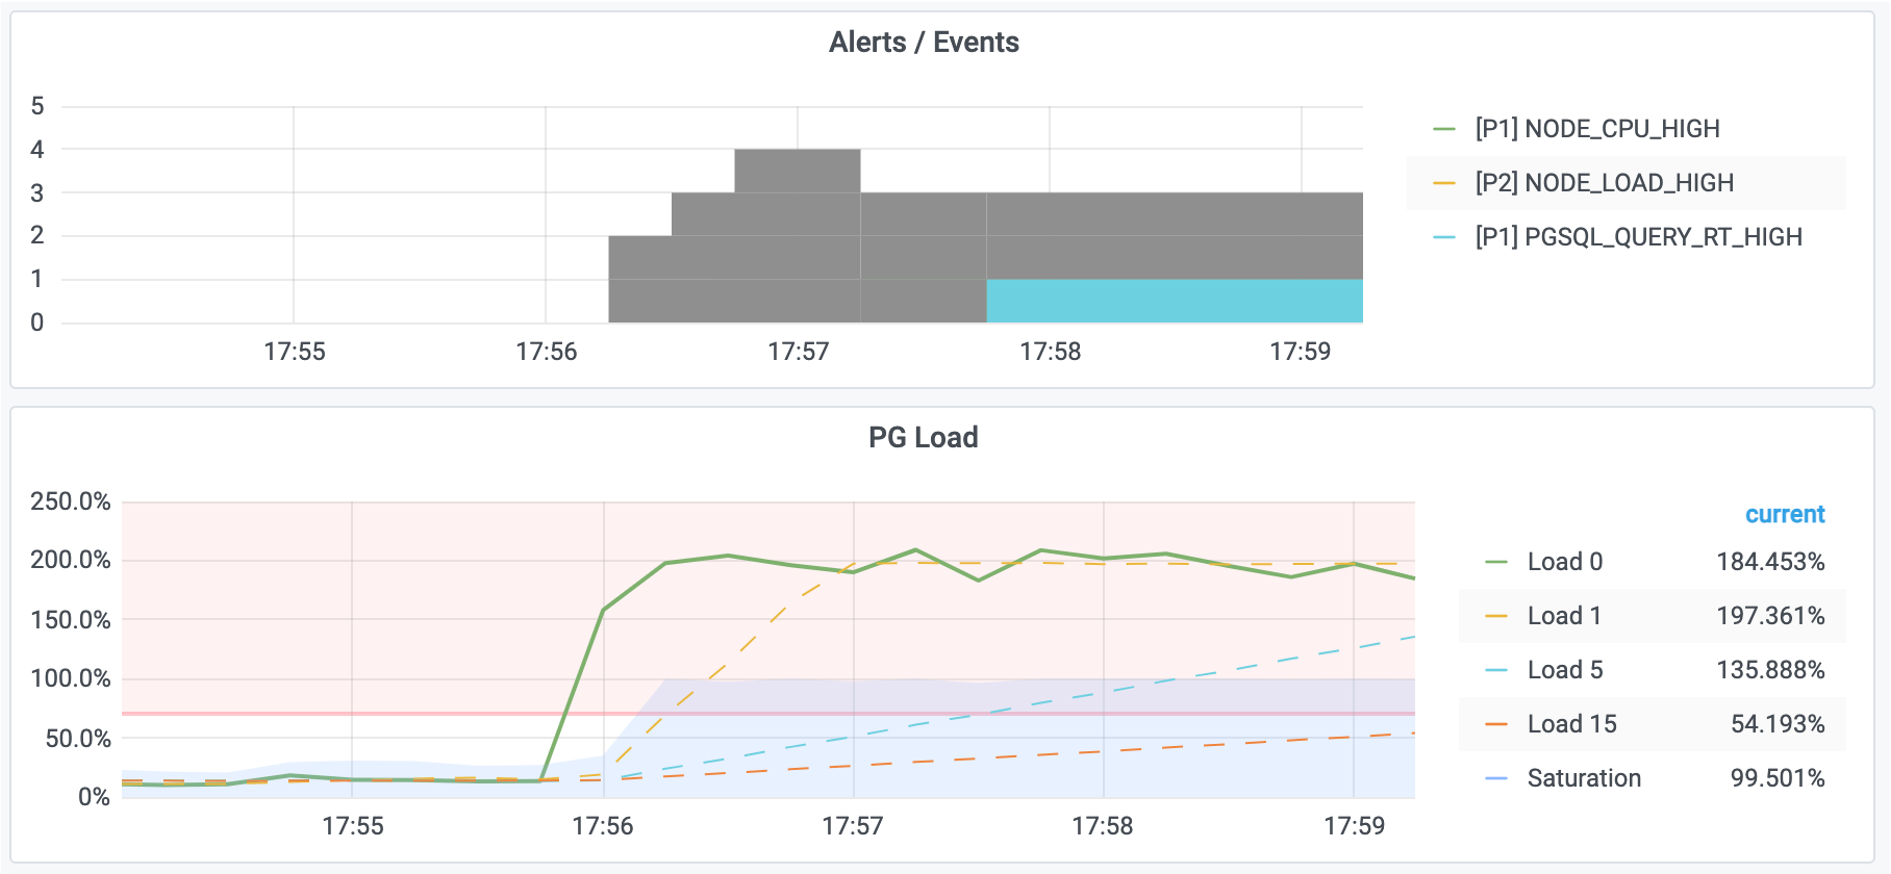
Figure 2: System load reaches 200%, triggering alerts for high machine load and excessive query response time.
Locating Slow Queries
First, use the PG Cluster panel to locate the specific instance with slow queries, in this case pg-test-2.
Then, use the PG Query panel to locate the specific slow query: ID -6041100154778468427
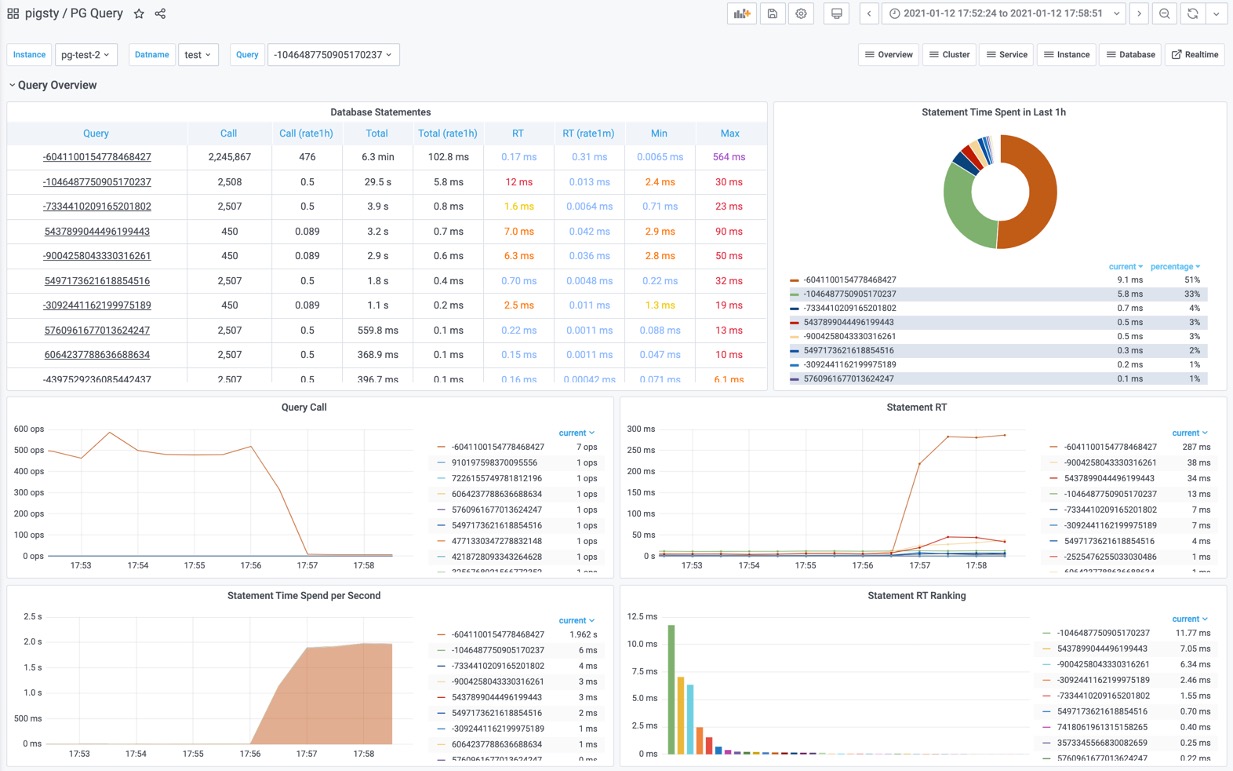
Figure 3: Identifying an abnormal slow query from the query overview
This query shows:
- Significant increase in response time: from 17us to 280ms
- Significant drop in QPS: from 500 to 7
- Significant increase in time spent on this query
We can confirm this is the slow query!
Next, use the PG Stat Statements panel or PG Query Detail to locate the specific statement of the slow query using the query ID.

Figure 4: Identifying the query statement as
SELECT abalance FROM pgbench_accounts WHERE aid = $1
Formulating Hypotheses
After identifying the slow query statement, we need to infer the cause of the slowness.
SELECT abalance FROM pgbench_accounts WHERE aid = $1
This query filters the pgbench_accounts table using aid as the condition. For such a simple query to slow down, it’s likely an issue with the table’s indexes. It’s obvious that we’re missing an index - after all, we just deleted it!
After analyzing the query, we can formulate a hypothesis: The query is slow because the aid column in the pgbench_accounts table is missing an index.
Next, we need to verify our hypothesis.
First, use the PG Table Catalog to examine table details, such as indexes on the table.
Second, check the PG Table Detail panel to examine access patterns on the pgbench_accounts table to verify our hypothesis:
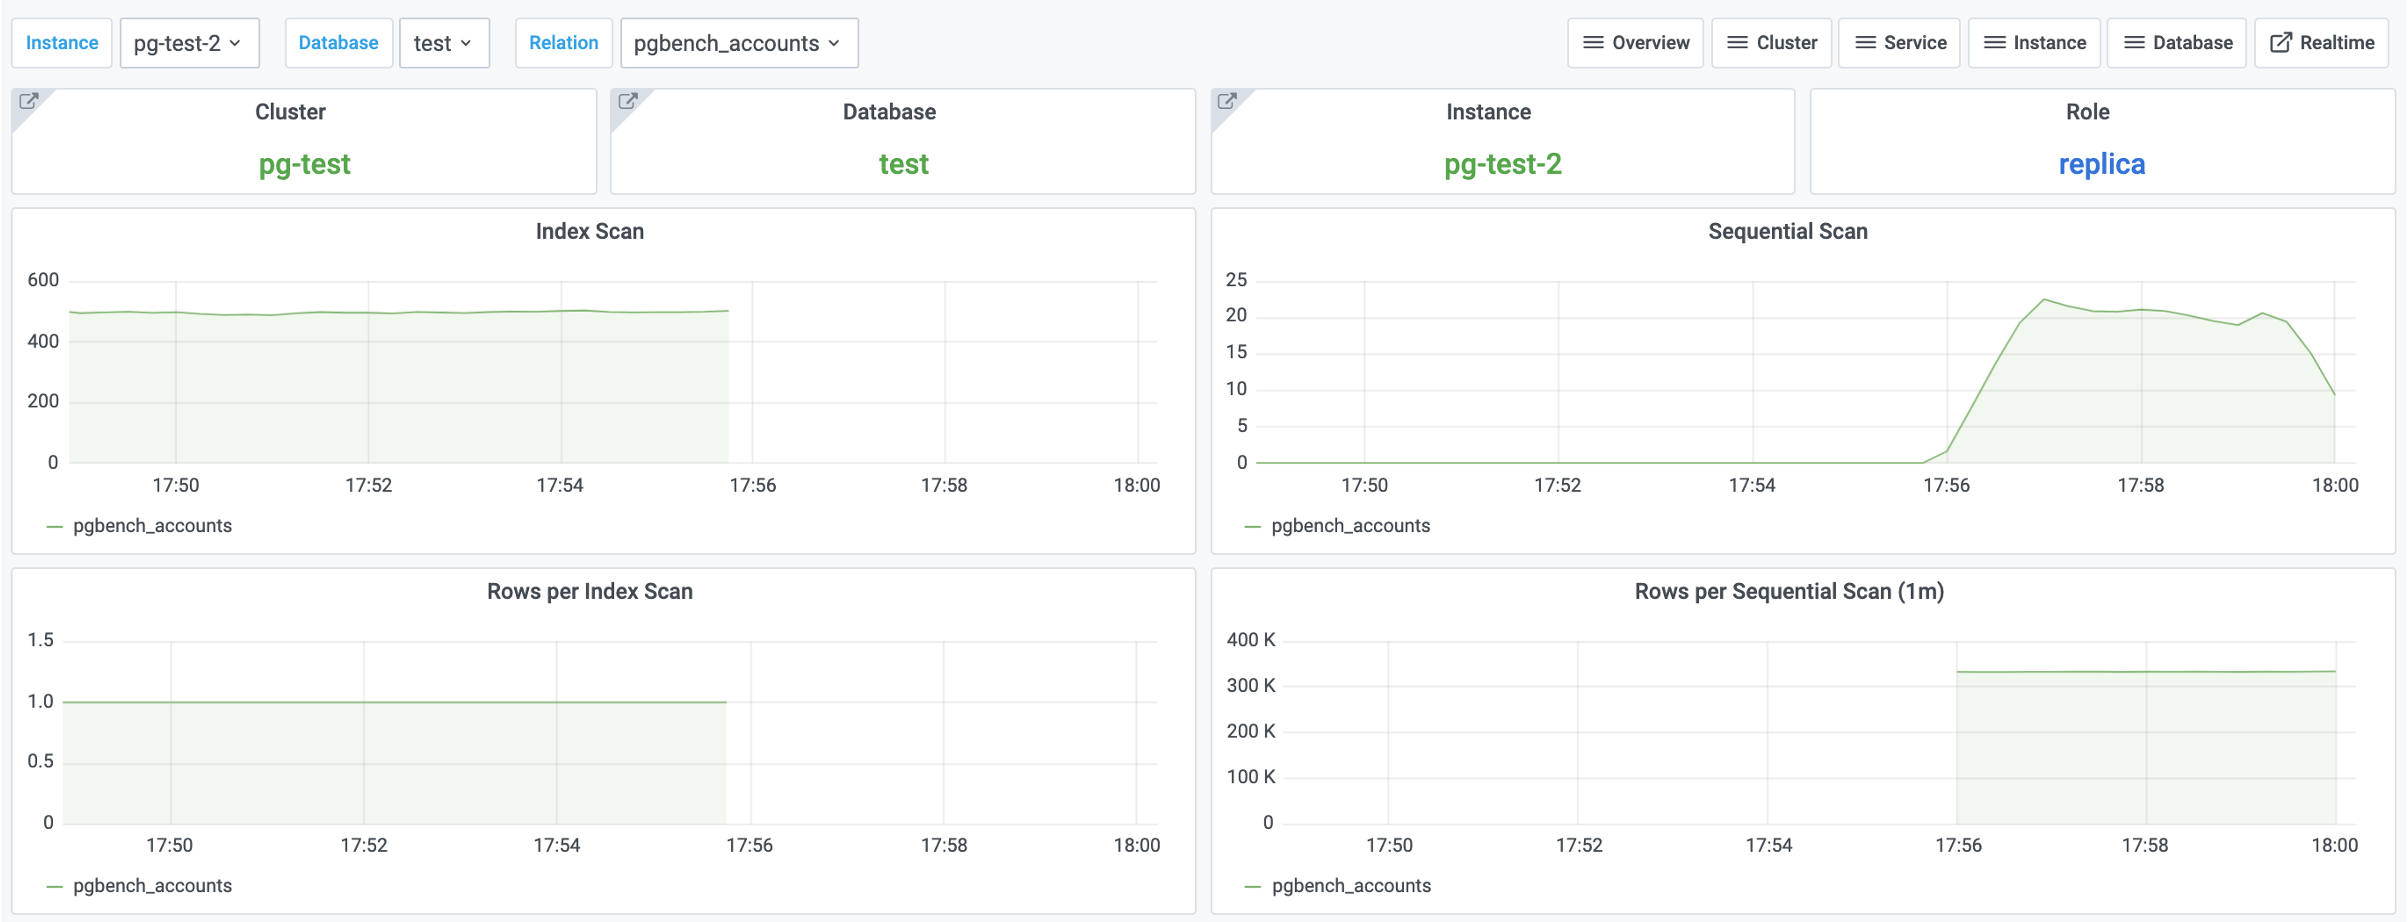
Figure 5: Access patterns on the
pgbench_accountstable
We observe that index scans have dropped to zero, while sequential scans have increased accordingly. This confirms our hypothesis!
Implementing Solutions
Once our hypothesis is confirmed, we can proceed with implementing a solution.
There are typically three ways to solve slow queries: modify table structure, modify queries, or modify indexes.
Modifying table structure and queries usually requires specific business and domain knowledge, requiring case-by-case analysis. However, modifying indexes typically doesn’t require much specific business knowledge.
In this case, we can solve the problem by adding an index. The pgbench_accounts table is missing an index on the aid column, so let’s try adding an index to see if it resolves the issue:
CREATE UNIQUE INDEX ON pgbench_accounts (aid);
After adding the index, something magical happens:
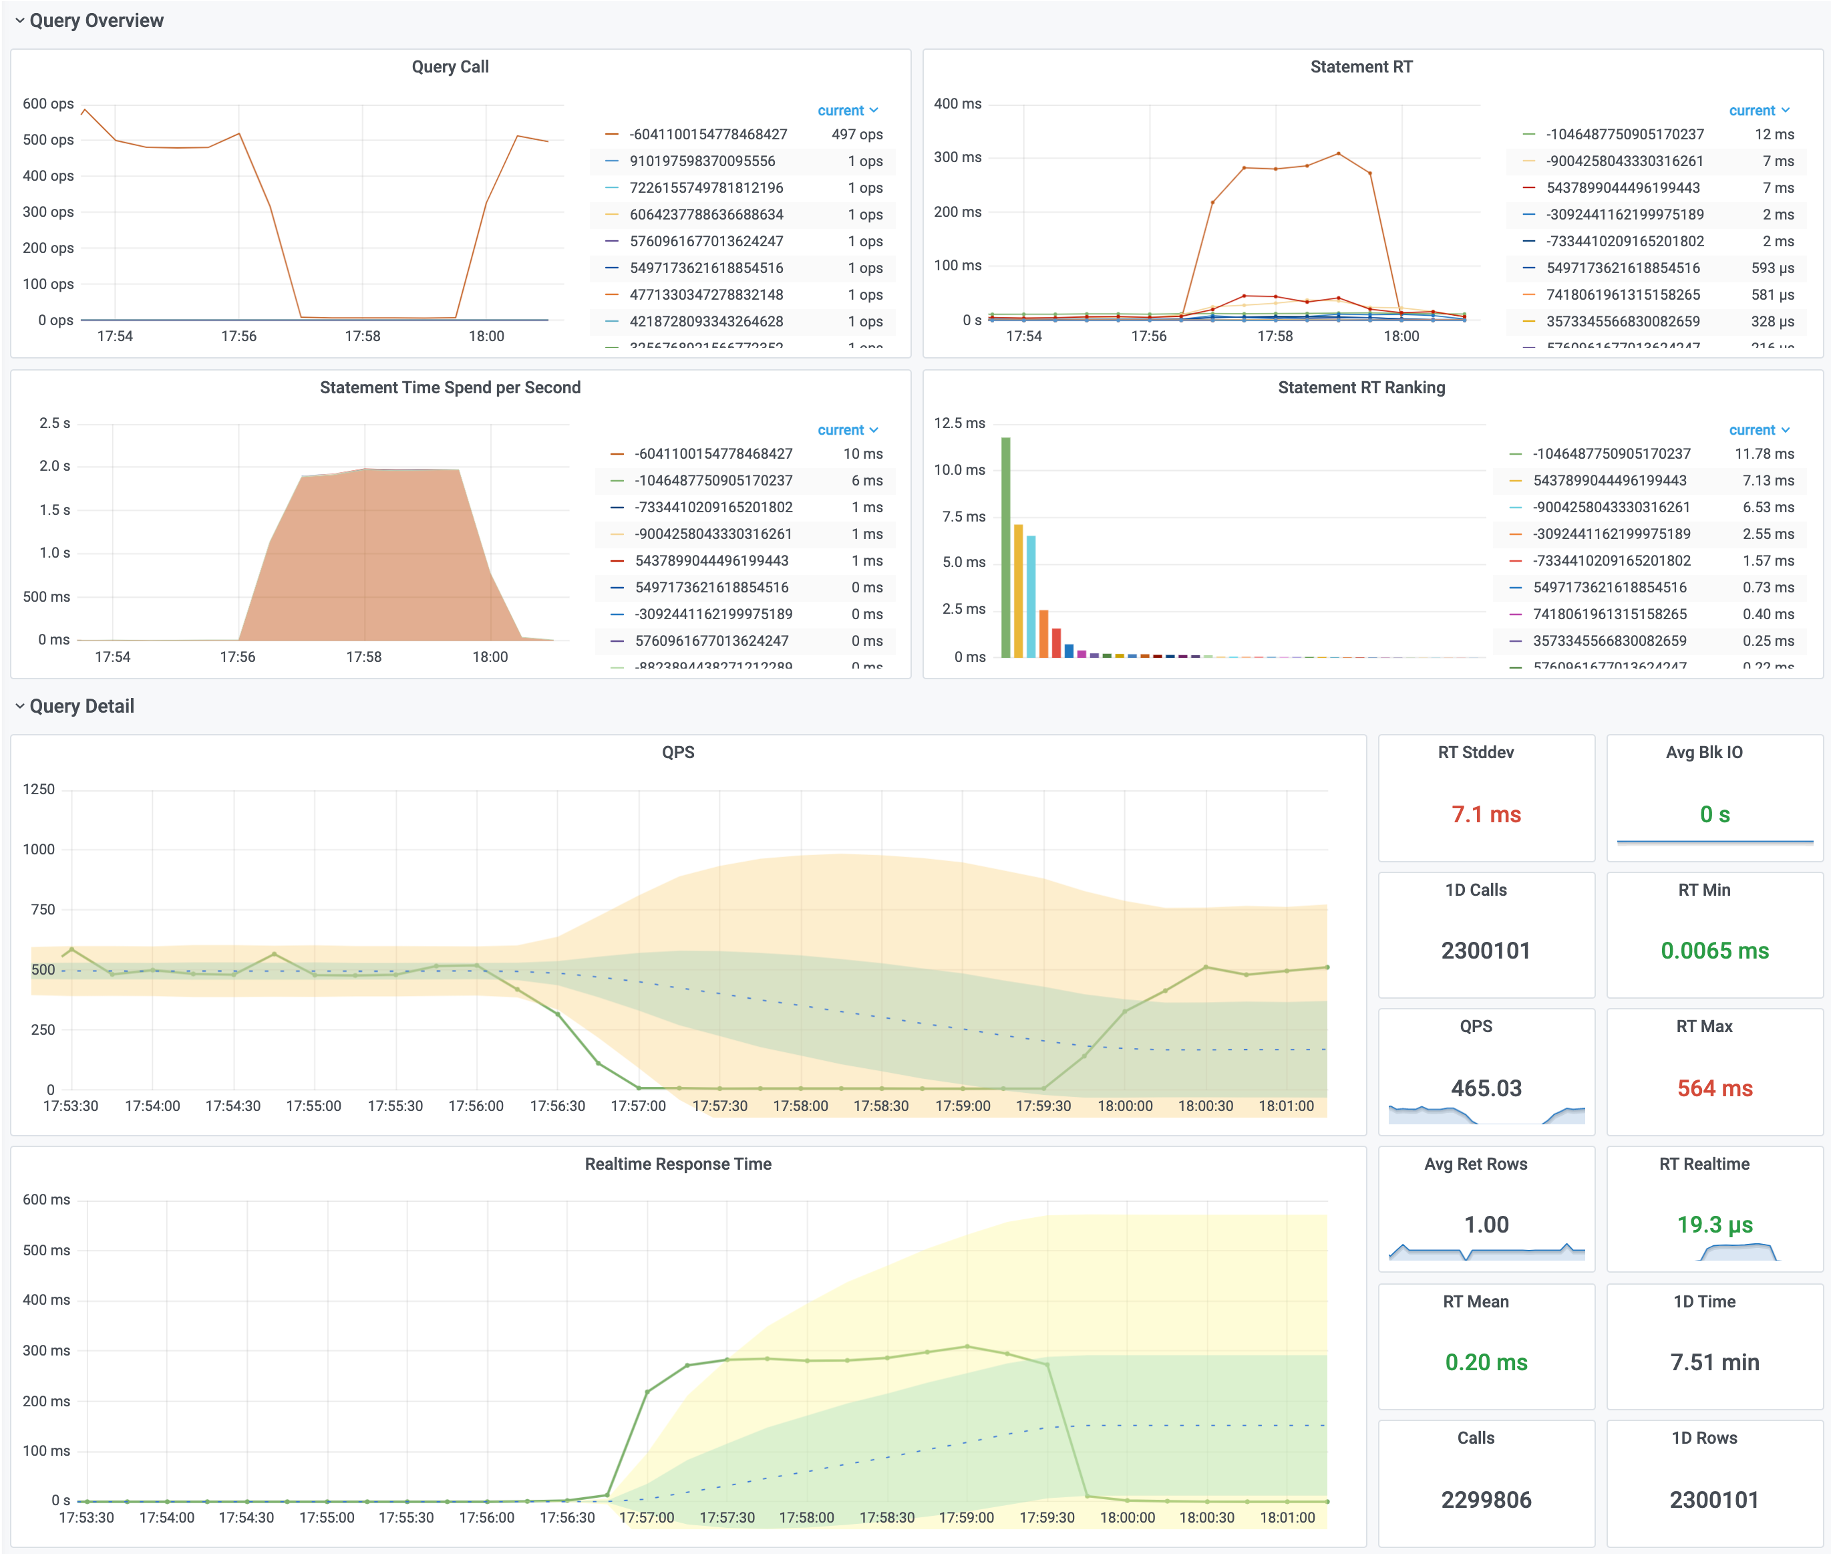
Figure 6: Query response time and QPS have returned to normal.
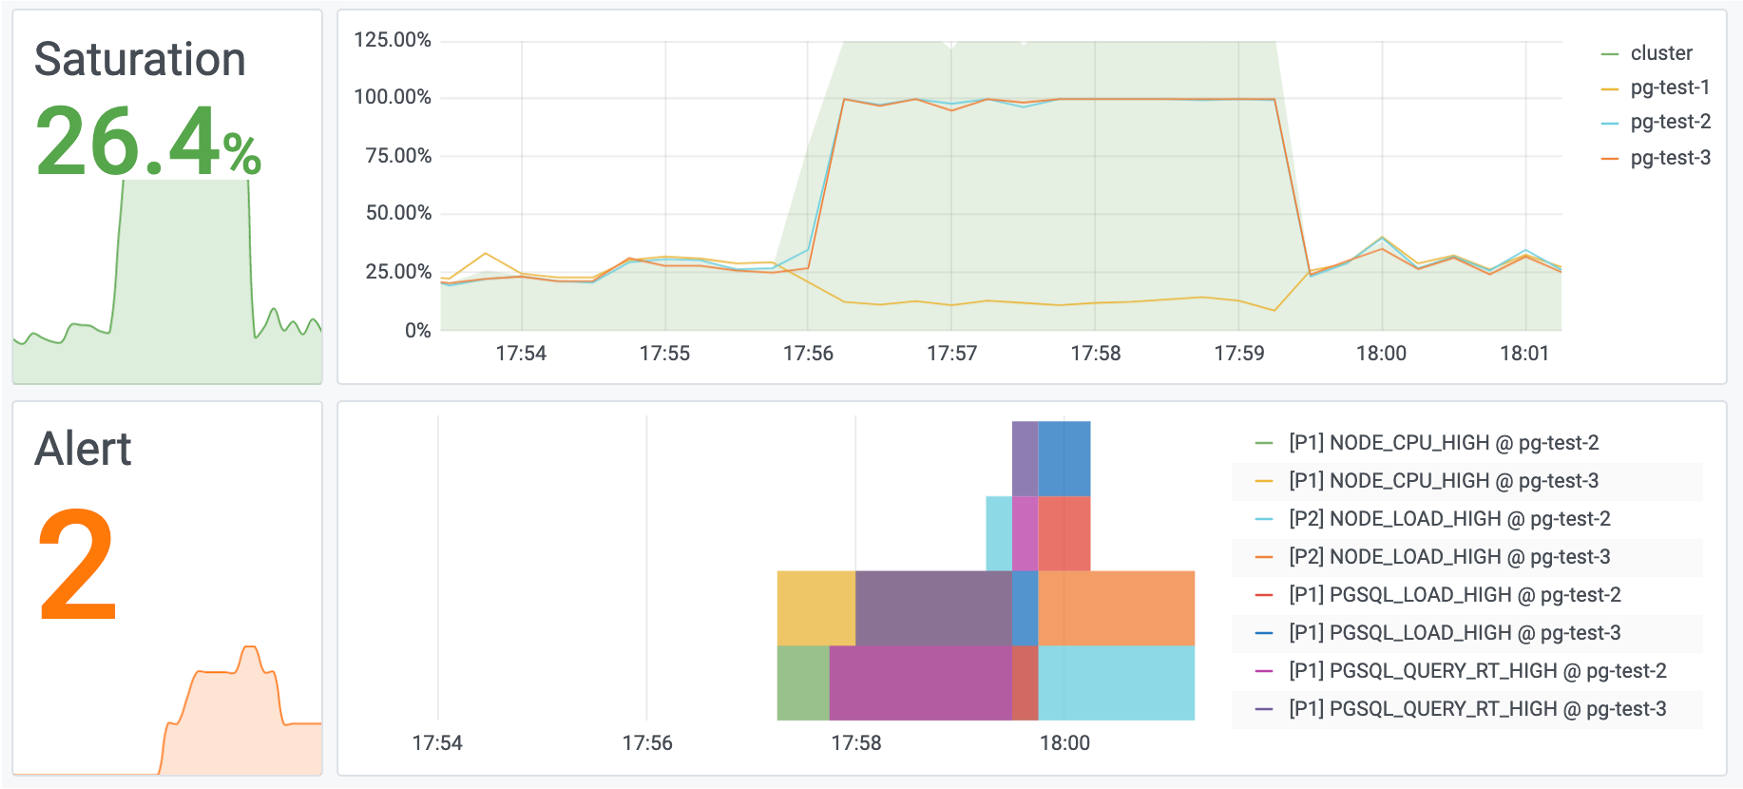
Figure 7: System load has also returned to normal.
Evaluating Results
As the final step in handling slow queries, we typically need to document the process and evaluate the results.
Sometimes a simple optimization can have dramatic effects. What might have required spending hundreds of thousands on additional machines can be solved by creating a single index.
These kinds of stories can be vividly demonstrated through monitoring systems, helping you earn KPI and credit.

Figure: Before and after optimizing a slow query, overall system saturation dropped from 40% to 4%
(Equivalent to saving X machines and XX dollars - your boss will be thrilled, and you’ll be the next CTO!)
Summary
Through this tutorial, you’ve learned the general methodology for slow query optimization:
- Locate the problem
- Formulate hypotheses
- Verify assumptions
- Implement solutions
- Evaluate results
The monitoring system plays a crucial role throughout the entire slow query handling lifecycle. It also helps express the “experience” and “results” of operations and DBAs in a visual, quantifiable, and reproducible way.